Polkadot (DOT/USDT) Targets Potential Breakout as Bullish Momentum Returns
Estimated Reading Time: 3 minutes
Don’t invest unless you’re prepared to lose all the money you invest. This is a high-risk investment and you are unlikely to be protected if something goes wrong. Take 2 minutes to learn more
Polkadot Short-term Analysis: Bullish
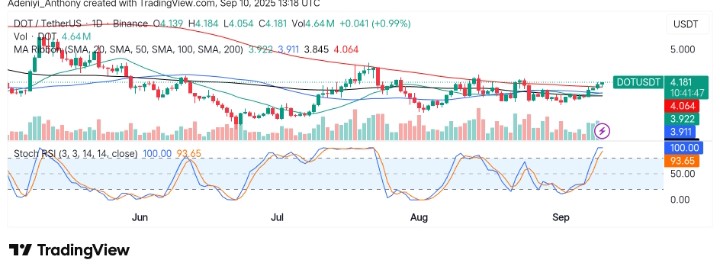
The sentiment around the Polkadot against the Tether market appears to be bullish. This can be seen in the positioning of the price above the Moving Average Ribbons, particularly the 50-day and 100-day SMAs.
As it stands, caution is needed, as the stochastic RSI seems to be showing overbought conditions, indicating that the pair may be approaching a price correction or a potential consolidation before moving higher.
Currently, Polkadot trades at $4.181, recording more than 4.64 million traded volumes for the day.
Technical Indicators
Major Resistance Levels: $4.200, $4.500, and $5.000
Major Support Levels: $4.060, $3.845, and $3.500
Polkadot Technical Analysis
The price of DOT has been steadily rising, with clear bullish momentum in the past few days, particularly after a period of consolidation that lasted till August. However, the price is currently approaching resistance, as shown by the activity of the price above the red dotted trend line at $4.06. If this support holds and the price breaks further above this level with volume, a more significant rally toward the next resistance zones can be expected.
However, the stochastic RSI is showing overbought conditions, with the blue line moving above 90, suggesting the possibility of a price pullback or consolidation within a bullish framework.
To this end, if Polkadot holds strongly above $4.06, a move towards 5.000 would materialize. Conversely, there is a risk of pullback before further upside due to the overbought condition of the Stochastic RSI.
Polkadot Nearing Breakout
It appears like Polkadot is set for a breakout towards $5.03. Checking the trend line that connects the 52-week high and low, it is obvious that DOT has a chance to break out from the current range. However, if the price fails to break above the $4.20 or $4.22 level, a historical bottom level may be the next target before a bounce to the north.
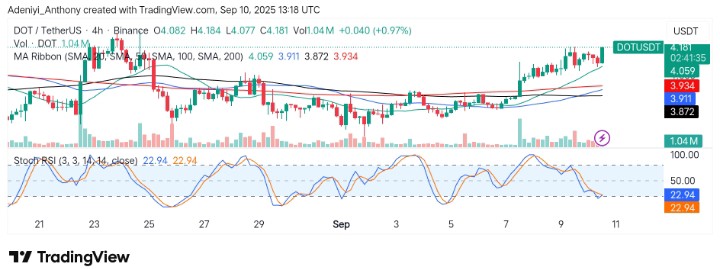
DOTUSDT 4H Analysis: Gearing Up for More Gains
In the 4-hour chart for DOT/USDT, the pair appears to be poised for potential short-term gains as the Stochastic RSI curls upside.However, in previous sessions, the price had originally operated below the cluster of the moving averages, but it seems it is now operating above the moving average ribbons.
As it stands, the price is currently testing resistance close to the $4.200 level with a possible extension towards $5.000. To this end, if the price receives more bullish attention, the $5.000 would be broken as signaled by the rising momentum oscillator; otherwise, failure to hold above $3.85 in this session might lead to a breakdown.
You can purchase crypto coins here. Buy Crypto