Polkadot (DOT/USDT) Shows Sideways Pressure as Market Awaits a Breakout
Estimated Reading Time: 3 minutes
Don’t invest unless you’re prepared to lose all the money you invest. This is a high-risk investment and you are unlikely to be protected if something goes wrong. Take 2 minutes to learn more
Polkadot Daily Analysis: Ranging
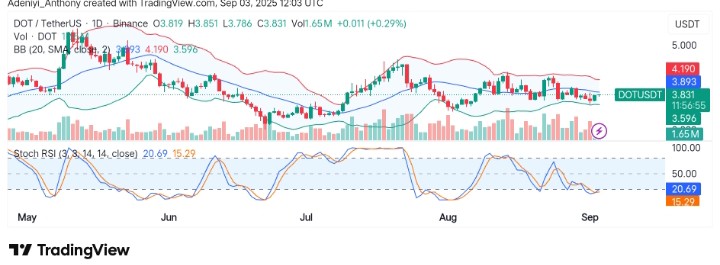
The market for Polkadot against Tether has been moving sideways in recent weeks, showing indecision among traders. However, after periods of sharp upward and downward moves, the price is now consolidating around the $3.80 zone. Also, the Bollinger Bands are tightening, hinting at an upcoming breakout in the near term.
Meanwhile, the Stochastic RSI is operating near the oversold region, suggesting that buyers may soon return to the market, as the overall sentiment remains cautious, but the setup is preparing for a possible strong movement.
Currently, Polkadot trades at $3.835, recording more than 1.60 million traded volumes for the day.
Technical Indicators
Major Resistance Levels: $3.900, $4.190, and $4.500
Major Support Levels: $3.600, $3.3000, and $3.000
Polkadot Technical Analysis
Technically, Polkadot against Tether has been consolidating within a narrow range on the daily timeframe. However, the tightening Bollinger Bands are indicating there might be a breakout in the market soon, as the low volatility signals an impending sharp move.
From the bottom of the chart, the Stochastic RSI reads around the 20-mark level, suggesting an oversold condition, but the curvature of the lines suggests bullish momentum is returning. To this end, if more buyers step in, a break above $3.90 would indicate a potential breakout above $4.500; otherwise, the pair will continue its range-bound activity.
DOT/USDT Short-term Analysis: Momentum Points to a Potential Breakout
On the 4-hour chart, DOT/USDT is displaying short-term strength above the middle band. However, the Stochastic RSI is overbought, signaling that buyers are currently in control but may face exhaustion soon. Also, the price appears to be pushing against the upper Bollinger Bands, building a base above the dynamic Stochastic line, as the structure indicates more gains can be made.
To this end, if the bulls can hold above $3.77, momentum could extend toward $4.00. However, failure to break and sustain above $3.86 could lead to a minor pullback due to the overbought condition.
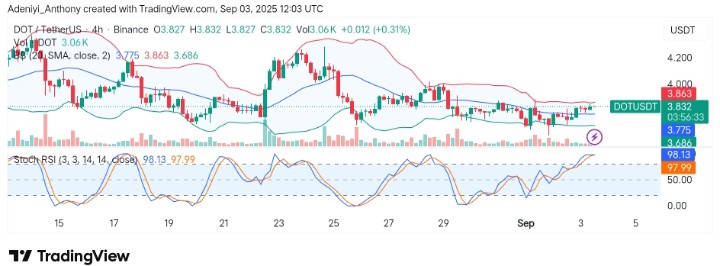
Put together, both the daily and 4H charts suggest that the pair is preparing for a big move, but till then, Polkadot needs to be resilient and maintain its current structure.
🔷️ $DOT (Polkadot) continues to display a Wyckoff Accumulation Structure on its weekly chart.
🔺 If the formation remains valid, the yellow lines on the chart mark potential reaction areas worth monitoring.
⚠️ This is not investment advice.#crypto #cryptocurrency #bitcoin… https://t.co/571HQDuJkY pic.twitter.com/RJ6ohGAVwD
— The Boss (@Crypto_TheBoss) September 2, 2025
Meanwhile, @crypto_TheBoss has pointed out that Polkadot is displaying an accumulation structure on the larger timeframe, stating that if that structure is maintained, the marked reaction areas are worth waiting on.
You can purchase crypto coins here. Buy Crypto