Bitcoin (BTC/USD) Market Hovers, Transacting Above $27,000
Estimated Reading Time: 3 minutes
Don’t invest unless you’re prepared to lose all the money you invest. This is a high-risk investment and you are unlikely to be protected if something goes wrong. Take 2 minutes to learn more
Bitcoin Price Prediction – October 6
As there have been variant conditions representing buying and selling in the BTC/USD trade operations, as the crypto-economic market hovers around $28,000 and is transacting above the point of $27,000, buyers have to add more to their muscles to push northward.
As a recession seems to be taking hold over a few sessions, the market will attempt to secure strong positions for bulls to prosper over the long term. However, if that premise turns out to be accurate, an aggressive pull-down move might happen on purpose to reenergize the support for long-position takers to leverage on.
BTC/USD Market
Key Levels:
Resistance levels: $29,000, $30,000, $31,000
Support levels: $26,000, $25,000, $24,000
BTC/USD – Daily Chart
The BTC/USD daily chart showcases the crypto-economic market hovers around the $28,000, transacting above $27,000.
The Upper Bollinger Band has placed around $28,035.89 as the middle horizontal line drew at $28,000. In continuation of the indicators’ reading reports, the Middle Bollinger Band is at $26,978.79, while the Lower Bollinger Band is at $25,921.70. The stochastic oscillators have traversed northbound to places 58.73 to 64.78, indicating that a path is maintained in the eastern direction.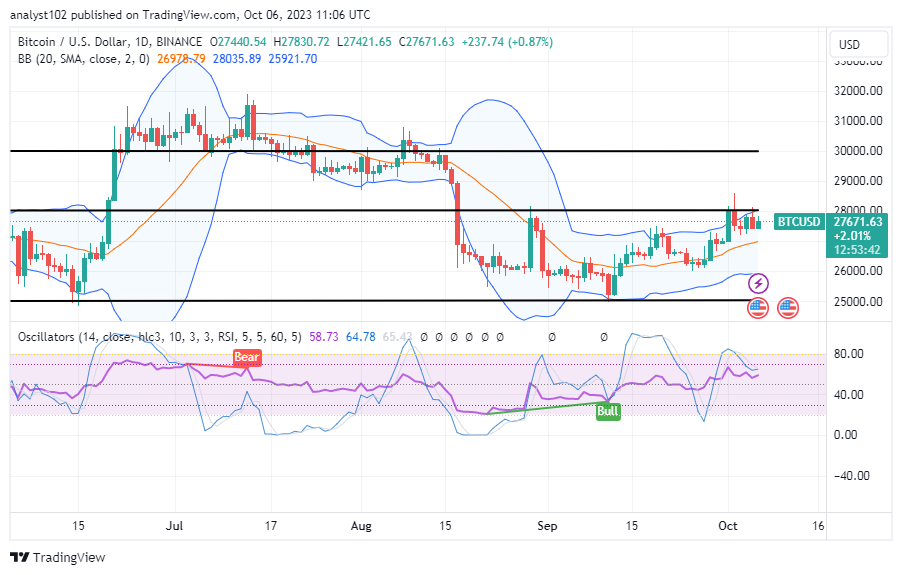
What is the BTC/USD market’s trade propensity potential over its current trading level?
The propensity forces the BTC/USD market to appear to be getting weaker as the crypto-economic trade hovers around $28,000, transacting above $27,000.
Longing of positions may be put on hold for a while as investors start to place orders from its current trading spot price of $27,671.63 and permit the orders to run for an extended period of time. Despite the fact that there will be additional opportunities for lowering prices, buyers must continue to earn points.
Given the current technical trade pattern, a draw up to the $29,000 resistance level is still possible. If there isn’t any immediate active motion, sellers might not be having it easy. Before acting, traders need to be in a strategic position.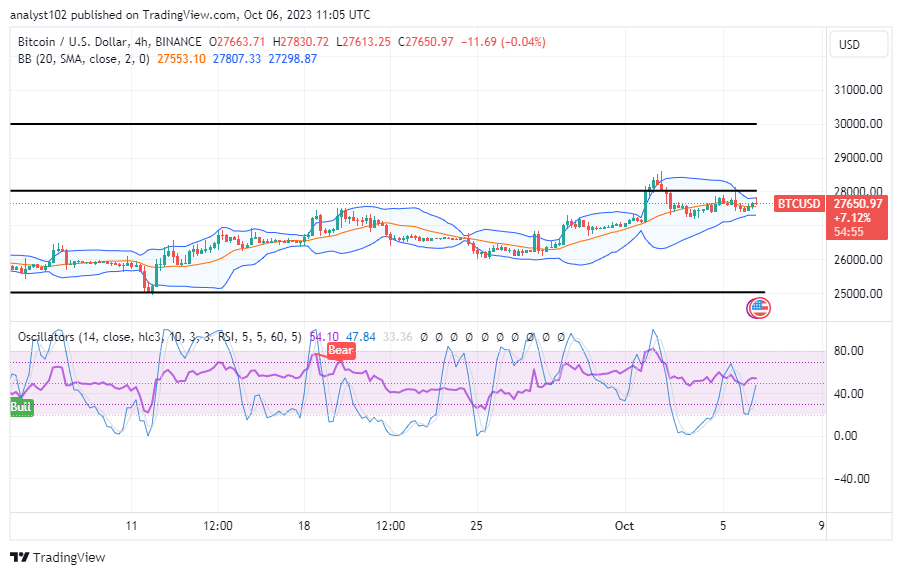
BTC/USD 4-hour Chart
The BTC/USD 4-hour chart mirrors the crypto economy, hovering around $28,000 and transacting above $27,000 at a close range.
The lower, middle, and upper Bollinger bands are all at $27,298.87, $27,553.10, and $27,807.33, respectively. The stochastic oscillators are pulsing between 47.84 and 54.10 values per second. According to the current chart view, it is likely that the market will have an active reversal movement from the $29,000 resistance level.
Note: Cryptosignals.org is not a financial advisor. Do your research before investing your funds in any financial asset or presented product or event. We are not responsible for your investing results.
You can purchase Lucky Block here. Buy LBLOCK