Chainlink Breaks above $18 High, May Face Rejection at $19.06
Estimated Reading Time: 2 minutes
Don’t invest unless you’re prepared to lose all the money you invest. This is a high-risk investment and you are unlikely to be protected if something goes wrong. Take 2 minutes to learn more

Free Crypto Signals Channel
Chainlink (LINK) Long-Term Analysis: Bearish
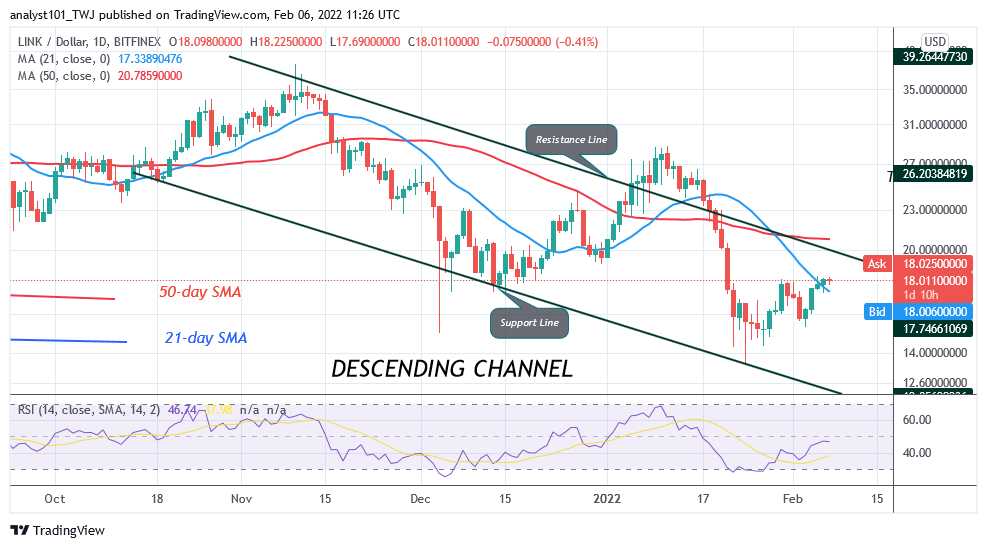
Chainlink’s (LINK) price is in an upward move but may face rejection at $19.06. The cryptocurrency has been trading in a range between $14 and $18 price levels since January 24. The bulls have been making frantic efforts to break the $18 resistance since January 30 but were repelled. Today, the bulls have broken the $18 resistance but the price movement is insignificant. Chainlink will rally to the $28 high if the bulls are successful above the recent high. The downward correction will resume if Chainlink turns from $18 resistance.
Chainlink (LINK) Indicator Analysis
The crypto’s price has broken above the 21-day SMA. It will signal the resumption of an uptrend if price breaks above the 50-day SMA. Similarly, the altcoin will be compelled to a range-bound move if the bulls fail to break the 50-day SMA. Chainlink is at level 47 of the Relative Strength Index Period 14. Despite the recent upward move, Chainlink is still in the bearish trend zone and below the centerline 50. Chainlink is above the 80% range of the daily stochastic. The altcoin has reached the overbought region of the market. It is likely to decline.
Technical indicators:
Major Resistance Levels – $40.00, $42.00, $44.00
Major Support Levels – $26.00, $24.00, $22.00
What Is the Next Direction for Chainlink (LINK)?
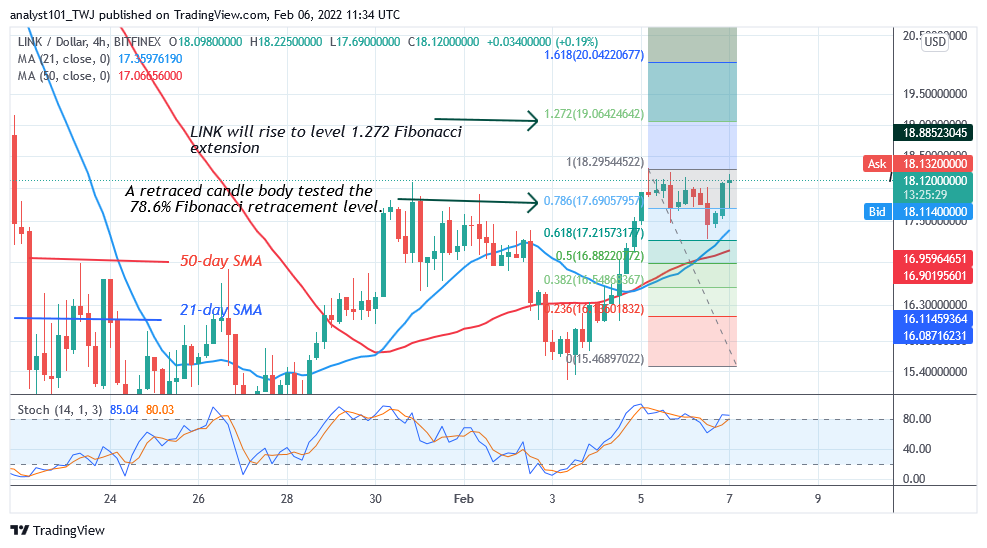
Chainlink is in a brief uptrend as it struggles below the $18 resistance but may face rejection at $19.06. Meanwhile, on February 5 uptrend; a retraced candle body tested the 78.6% Fibonacci retracement level. The retracement indicates that LINK will rise but reverse at level 1.272 Fibonacci extension or $19.06 low.
You can purchase crypto coins here. Buy Token
Note: Cryptosignals.org is not a financial advisor. Do your research before investing your funds in any financial asset or presented product or event. We are not responsible for your investing results