Ethereum (ETH/USD) Price Succumbs to a Downward Reversal Move
Estimated Reading Time: 3 minutes
Don’t invest unless you’re prepared to lose all the money you invest. This is a high-risk investment and you are unlikely to be protected if something goes wrong. Take 2 minutes to learn more

Free Crypto Signals Channel
Ethereum Price Prediction – April 11
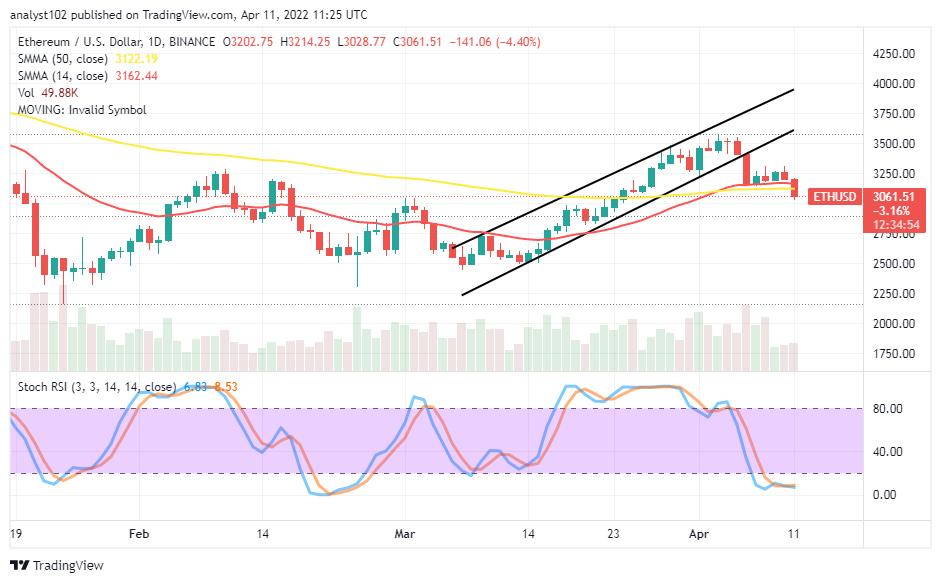
The ETH/USD market currently has it on the record that the crypto-economic price succumbs to a downward reversal motion in its valuation. The crypto trade has witnessed a high of $3,214 and a low of $3,028 at a negative percentage of 4.04.
ETH/USD Market
Key Levels:
Resistance levels: $3,250, $3,500, $3,750
Support levels: $3,000, $2,750, $2,500
ETH/USD – Daily Chart
The ETH/USD daily chart shows the crypto-economic price succumbs to a downward reversal. Price had earlier rallied to a high resistance zone of around $3,500. On April 5th, a bearish candlestick emerged beneath the value line to create an insight that has led to the present downing motion in business transactions. The 14-day SMA has been placed briefly over the 50-day SMA. And they are pointing to the east side, having breached to the downside presently by a bearish candlestick. The Stochastic Oscillators are in the oversold region. And they have conjoined their lines within it to indicate a degree of downing process is ongoing.
Will the ETH/USD market experience more downing motions as the crypto-economic price succumb to a downward reversal?
Presently, the forces to the downside in the ETH/USD market operations suggests uglier trading condition to get an early buying order at this point as the crypto-economic price succumbs to a downward reversal motion. Long-position takers have to be cautious of launching an entry against the forces to the down until a full-bullish candlestick formed from a depth of lower-trading zone before re-considering joining the market.
On the downside of the technical analysis, the ETH/USD market short-position takers may have to ride on the downing forces beyond the level at $2,950 to find support at a lower trading spot afterward. A re-occurrence of a day’s bullish candlestick at a particular material time around the lower trading arena will mean the crypto will be coming back against the US economy following that signal.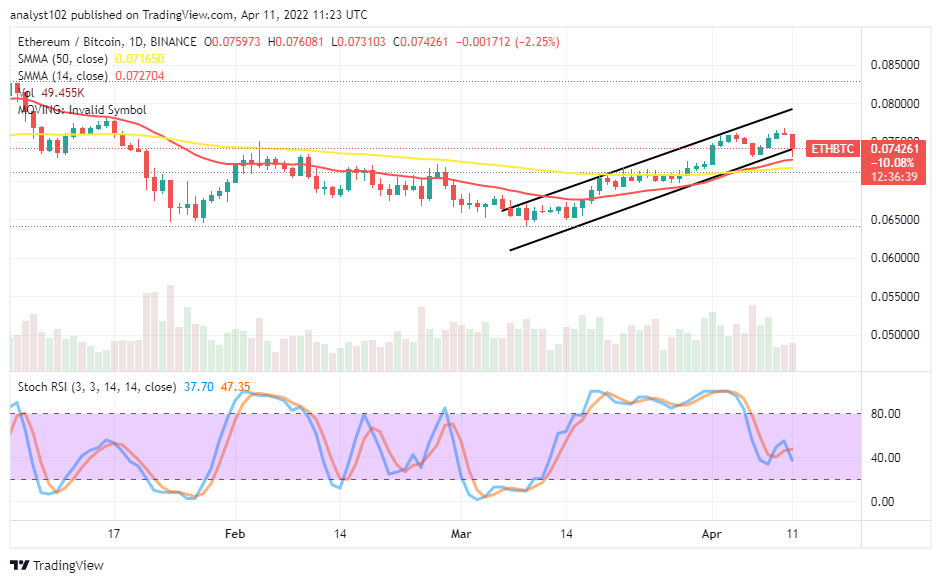 ETH/BTC Price Analysis
In comparison, Ethereum is in a downing move, pairing with Bitcoin on the price analysis chart. The cryptocurrency pair price succumbs to a downward reversal movement. The 14-day SMA indicator has briefly intercepted the 50-day SMA indicator to the upside direction. The Stochastic Oscillators are around 40 range-line, attempting to cross to the south side. The emergence of a bearish candlestick against the area of the SMAs interception point will mean the base crypto will have to go more for a downing process against the flagship counter crypto in the long run.
Note: Cryptosignals.org is not a financial advisor. Do your research before investing your funds in any financial asset or presented product or event. We are not responsible for your investing results.
You can purchase Lucky Block here. Buy LBlock: