$SPONGE (SPONGE/USD) Trapped in a Tug-of-War: Will Bulls or Bears Prevail?
Estimated Reading Time: 3 minutes
Don’t invest unless you’re prepared to lose all the money you invest. This is a high-risk investment and you are unlikely to be protected if something goes wrong. Take 2 minutes to learn more

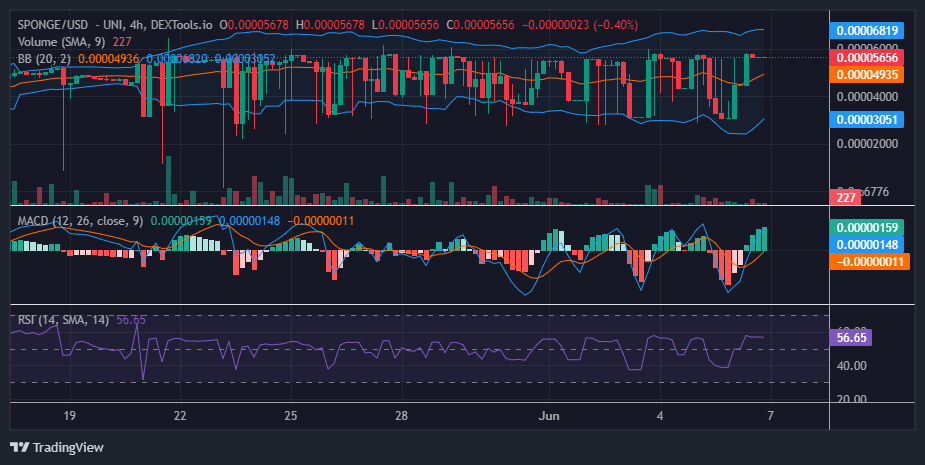
The battle lines are drawn in the SPONGE/USD market. Due to the resilience of both bulls and bears, the price has been ranging within the range of $0.000055 and $0.00004. Currently, the bulls have managed to maintain pressure at the $0.000055 level, a resistance that has withstood bearish pressure for an extended period. Although the price action has recently tested the $0.00006 level, buyers have not yet succeeded in pushing it higher. With sustained pressure at $0.000055, the critical question remains: will the bulls eventually break through this resistance?
Key Market Dynamics:
- Resistance Levels: $0.0010, $0.0011, and $0.0012.
- Support Levels: $0.000035, $0.000030, and $0.000025.
Delving into Technical Analysis for $SPONGE (SPONGE/USD)
Examining the indicators, the bears continue to hold their position at the $0.000055 price level. However, the Bollinger Bands indicator shows that the upper standard deviation is diverging upward, despite the resistance remaining fixed at $0.000055. Additionally, both standard deviation curves and the 20-day moving average are trending upward. The Moving Average Convergence and Divergence (MACD) indicator is also showing a strong bullish crypto signal, with bullish histograms and the two MACD lines crossing above the zero level, all indicating bullish momentum.
This market dynamic suggests a potential accumulation phase, where investors are gradually buying the asset in anticipation of a future price increase. Although this buying pressure may not yet be strong enough to trigger a significant price jump, it could result in a flat or slowly upward-trending movement.
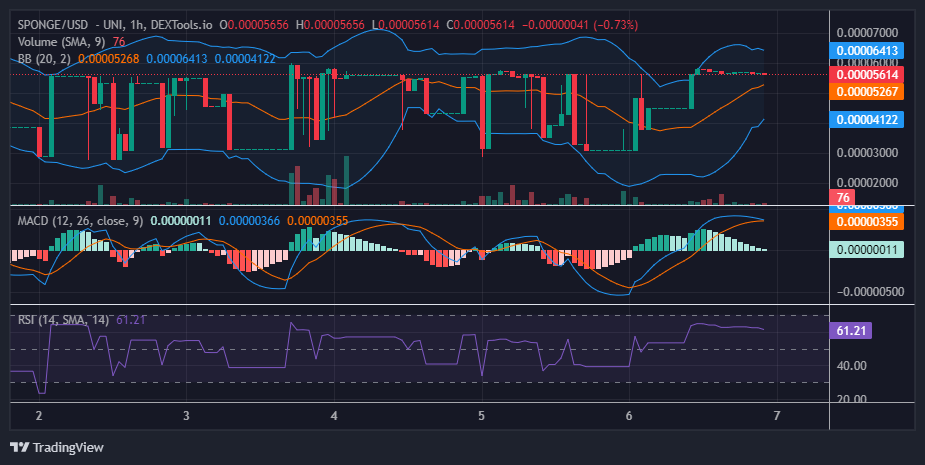
Insights from the 1-Hour Perspective
Analyzing the SPONGE/USD market from the perspective of the 1-hour chart reveals an overwhelming bearish signal. The MACD indicator suggests the market is about to shift into a bearish bias, with the price action nearing a cross below the zero level into the bearish zone. This outlook contrasts with the strong bullish bias indicated on the 4-hour chart. Despite this sharp decline noted by the indicators, the price action remains flat.
Buy SPONGE/USD!
🧽 CLAIM IS LIVE, #SPONGERS! 🧽
The moment you’ve been waiting for is here! 🔥
Follow these steps to claim your $SPONGE tokens.1️⃣ Visit the staking page on our website
👉https://t.co/lPbuIoygqR2️⃣ Connect the same wallet you used for your purchase.
3️⃣ Claim your $SPONGE… pic.twitter.com/n5EjiUz6vw
— $SPONGE (@spongeoneth) May 30, 2024
Invest in the hottest and best meme coin. Buy Sponge ($SPONGE) today!