$SPONGE ($SPONGE/USD) Squeezed in a Tug-of-War: Will Bulls or Bears Buckle?
Estimated Reading Time: 2 minutes
Don’t invest unless you’re prepared to lose all the money you invest. This is a high-risk investment and you are unlikely to be protected if something goes wrong. Take 2 minutes to learn more

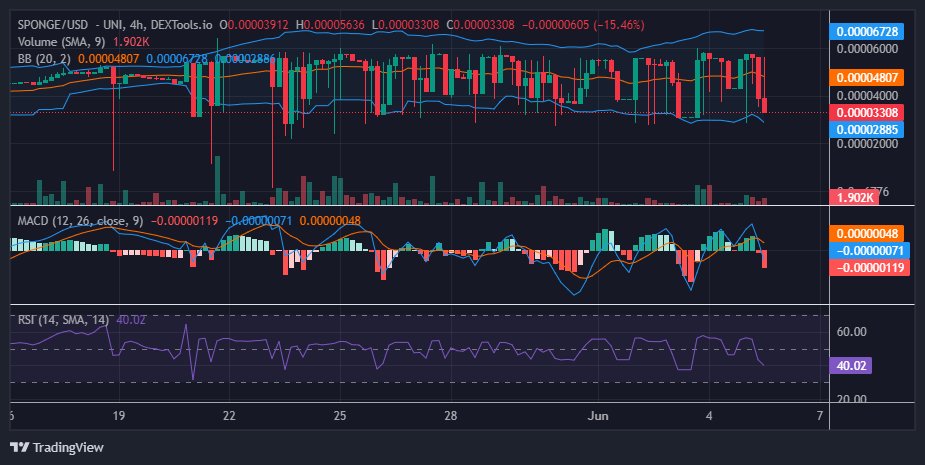
The battle for $SPONGE is a tense stalemate. Bears maintain their grip between $0.000055 and $0.00006, while bulls stubbornly defend against further dips, currently holding their ground at $0.00003. Recently, bears launched a successful offensive, pushing the price below the $0.00004 level towards a precarious $0.00003 floor. This broader range has resulted in heightened volatility, with $SPONGE swinging wildly within a wider channel.
Key Market Dynamics:
- Resistance Levels: $0.0010, $0.0011, and $0.0012.
- Support Levels: $0.000035, $0.000030, and $0.000025.
Delving into Technical Analysis for $SPONGE (SPONGE/USD)
The recent price swings have caused the Bollinger Bands to diverge, reflecting increased bearish pressure. Bulls were forced to retreat, with the price now oscillating between a new, lower range of $0.00006 and $0.00003. The downtrend is undeniable, pushing closer to the crucial $0.00003 support level.
Despite the bearish dominance, there’s a glimmer of hope. The low trading volume, indicated by the volume indicator, suggests the market remains volatile even during this downturn. This volatility could prevent a complete breakdown below $0.00003, as bullish sentiment around this level might easily turn the market back upward.
Insights from the 1-Hour Perspective
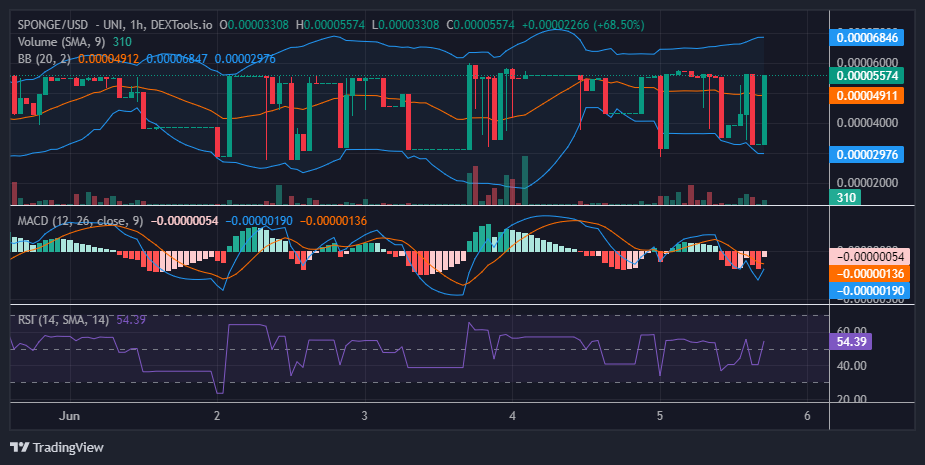
Mirroring the broader crypto market sentiment, all indicators on the 1-hour chart point bearish. However, the high volatility makes it a guessing game for traders. The rapid price swings between $0.000055 and $0.00003 suggest the market needs to find some stability before a clear direction emerges.
There’s something cooking in the $SPONGEV2 laboratories.
Damn, it feels good to be a #SPONGER! 🧽 🚀 🔥 #SpongeV2 #MemeCoins #100x pic.twitter.com/Omds25JMnp
— $SPONGE (@spongeoneth) June 4, 2024
Invest in the hottest and best meme coin. Buy Sponge ($SPONGE) today!