Ripple Makes Impressive Bullish Runs to $0.86, May Retrace to $0.80 Low
Estimated Reading Time: 2 minutes
Don’t invest unless you’re prepared to lose all the money you invest. This is a high-risk investment and you are unlikely to be protected if something goes wrong. Take 2 minutes to learn more

Free Crypto Signals Channel
Ripple (XRP) Long-Term Analysis: Bullish
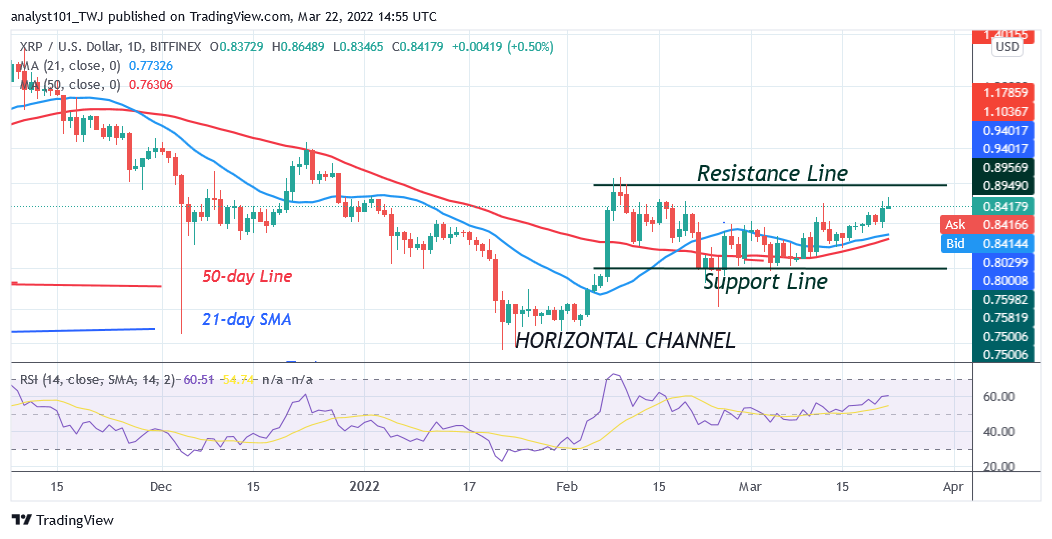
Ripple’s (XRP) price has risen to the high of $0.86 but may retrace to $0.80 low. The altcoin is likely to decline as the market reaches the overbought region. The bears are selling at the $0.90 resistance zone. In previous price action, XRP was repelled at the $0.90 resistance zone and it fell to $0.75 low. The bulls bought the dips to resume a fresh uptrend. The second uptrend is facing rejection as it declines to the low of $0.80. On the upside, if the bulls had broken the recent high, XRP would have reached the high $0.90 or $1.00 price level. Presently, the cryptocurrency is declining after reaching the high $0.86. The decline may extend to a low of $0.80.
Ripple (XRP) Indicator Analysis
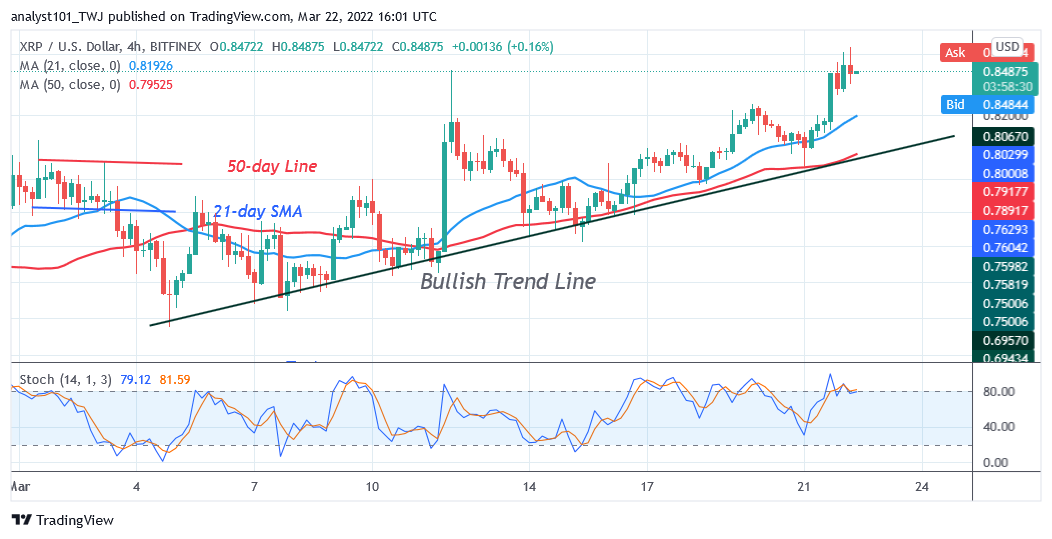
The crypto’s price bars are above the moving averages as the altcoin continues its upward move. XRP is above the 80% range of the daily stochastic. It indicates that the market has reached the overbought region. Sellers will emerge in the overbought region to push price down. The 21-day line and the 50-day line moving averages are sloping horizontally indicating a sideways trend.
Technical indicators:
Major Resistance Levels – $2.00, $2.50, $3.00
Major Support Levels – $1.50, $1.00, $0.50
What Is the Next Direction for Ripple (XRP)?
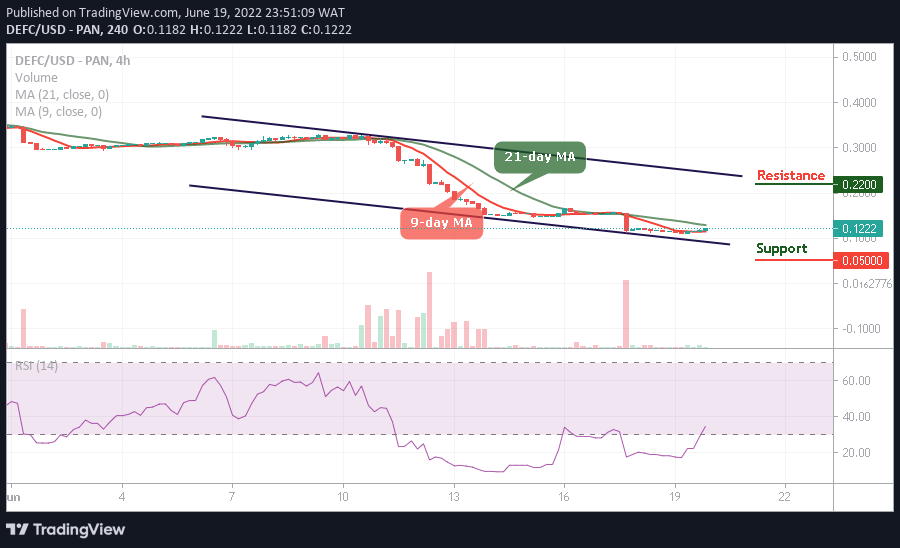
On the 4 –hour chart, XRP/USD is in an uptrend but may retrace to $0.80 low. The market has risen to the high of $0.86 as the altcoin faced resistance. The bears are selling at each resistance level. XRP/USD is likely to retrace to the support above the moving averages. The bullish momentum will resume to the upside. However, if XRP retraces and breaks below the moving averages, the downtrend will resume.
You can purchase crypto coins here. Buy LBlock
Note: Cryptosignals.org is not a financial advisor. Do your research before investing your funds in any financial asset or presented product or event. We are not responsible for your investing results