Ethereum Fluctuates Above $2,500 Support, May Slide to $2,301 Low
Estimated Reading Time: 2 minutes
Don’t invest unless you’re prepared to lose all the money you invest. This is a high-risk investment and you are unlikely to be protected if something goes wrong. Take 2 minutes to learn more

Free Crypto Signals Channel

Ethereum Price Long-Term Analysis: Bearish
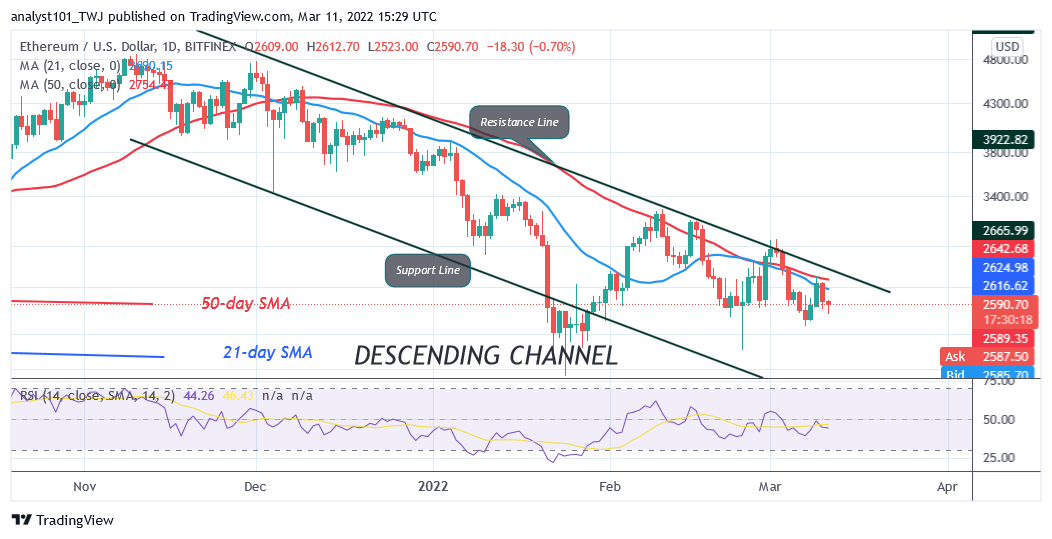
Ethereum’s (ETH) price is in a downward correction as the altcoin may slide to $2,301 low. Yesterday, buyers could not break above the moving averages, hence the downward move. This has been the price action since February 9. From the price action, the bears will sell after each rally by the bulls. Each time buyers fail to break above the moving averages, the largest cryptocurrency will continue to make a lower low. ETH/USD will revisit the previous lows of $2,301 or $2,160 if the selling pressure persists. On the upside, if the bulls break above the moving averages and the bullish momentum is sustained, Ether will be out of downward correction. Ethereum will resume upside momentum if price breaks the resistance at $3,200.
Ethereum Indicator Analysis
Ether has fallen to level 44 of the Relative Strength Index for period 14. It is in a downtrend zone and below the centerline 50. The altcoin is capable of failing to the downside. The moving averages are sloping downward indicating the downtrend. Ether is below the 30% range of the daily stochastic. The stochastic bands are sloping horizontally indicating the sideways trend.
Technical indicators:
Major Resistance Levels – $2, 600, $2,800, $3,000
Major Support Levels – $1.500, $1, 300, $1,100
What Is the Next Direction for Ethereum?
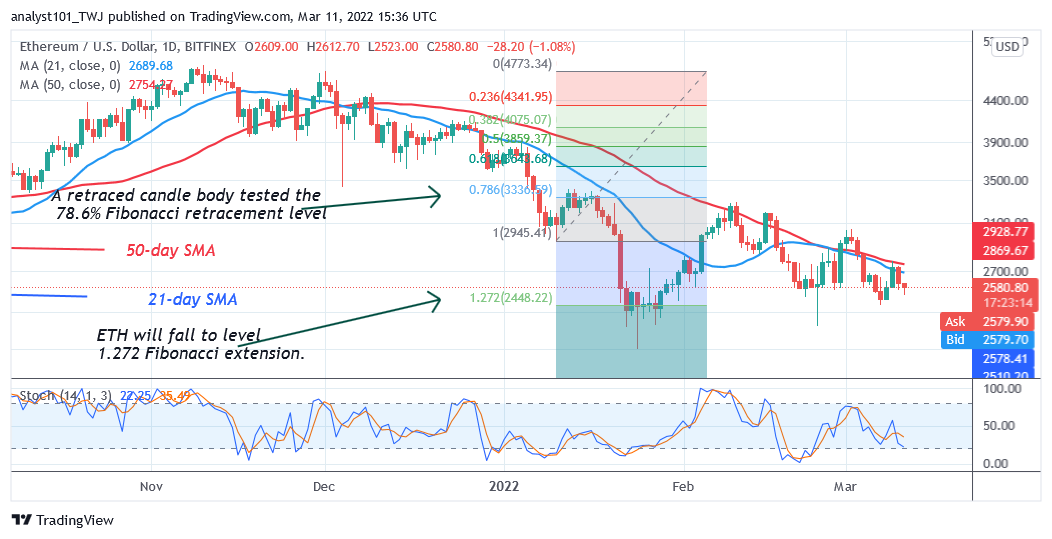
ETH/USD is in a downward correction as it may slide to $2,301 low. Meanwhile, on January 9 downtrend; a retraced candle body tested the 78.6% Fibonacci retracement level. The retracement indicates that ETH will fall to level 1.272 Fibonacci extension or $2,448. Ether price is fluctuating above level 1.272 Fibonacci extension.
You can crypto coins here. Buy LBlock
Note: Cryptosignals.org is not a financial advisor. Do your research before investing your funds in any financial asset or presented product or event. We are not responsible for your investing results