$SPONGE (SPONGE/USD) at a Crossroads: Bulls Defend Key Support, Signaling Potential for Imminent Price Surge
Estimated Reading Time: 3 minutes
Don’t invest unless you’re prepared to lose all the money you invest. This is a high-risk investment and you are unlikely to be protected if something goes wrong. Take 2 minutes to learn more

SPONGE/USD ($SPONGE) is currently demonstrating remarkable fortitude, with its price action firmly established above the $0.00011 anchor point. This sustained defense of a crucial support level suggests that despite the broader bearish market conditions, underlying bullish conviction remains potent. The consistent ability of buyers to hold this ground hints at a significant accumulation phase, potentially leading to a decisive shift. As market forces converge and volatility compresses, $SPONGE appears to be approaching a critical inflection point, with a bullish breakout becoming an increasingly probable outcome, pending shifts in trading volume and overall market sentiment.
Critical Technical Zones
- Resistance Levels: $0.000115, $0.000120, $0.000130
- Support Levels: $0.000090, $0.000085, $0.000080
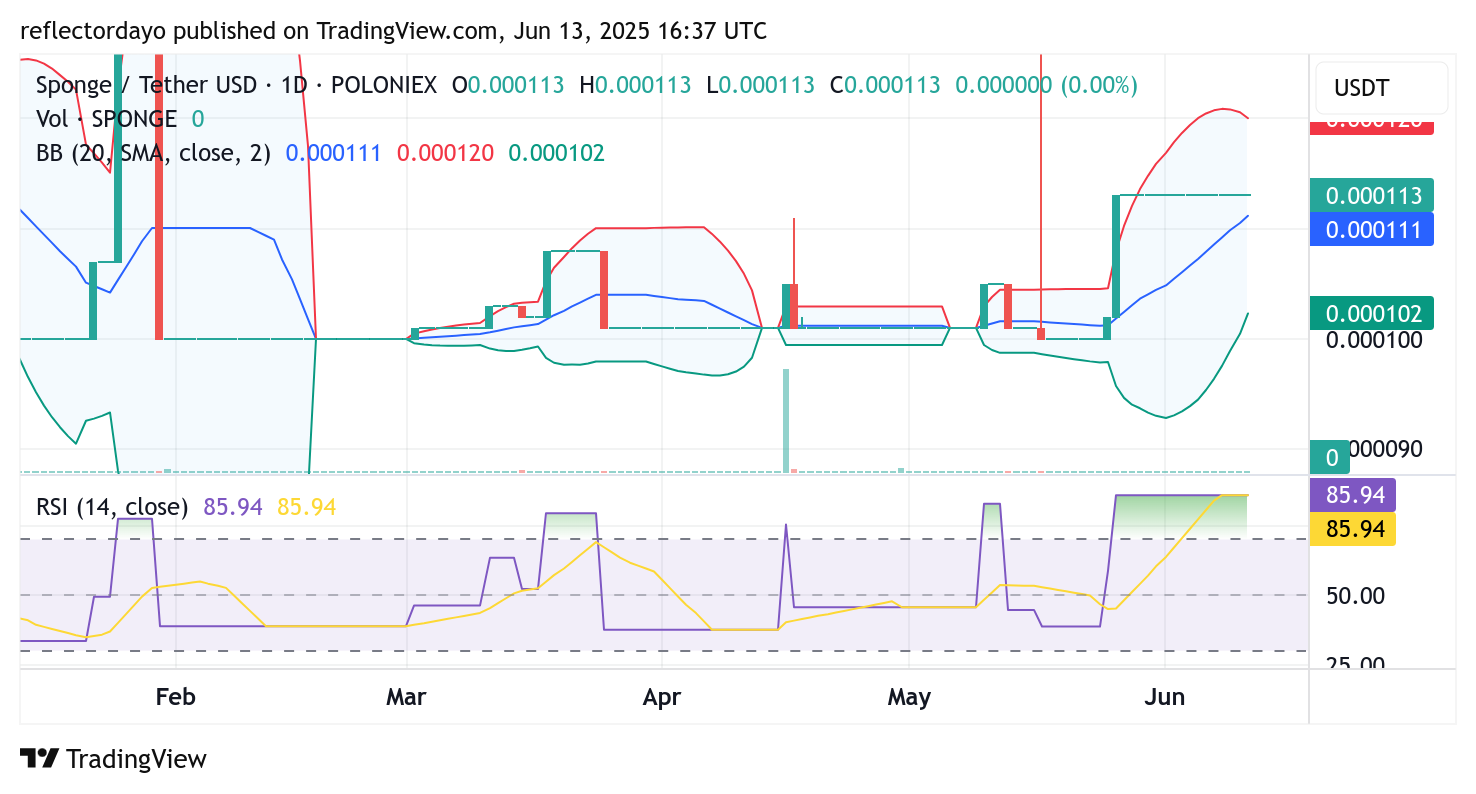
Daily Chart Insights: The Calm Before the Storm for $SPONGE?
Analyzing the daily chart, SPONGE/USD clearly exhibits a tightening price range, a pattern confirmed by the contracting Bollinger Bands. This reduction in volatility often precedes a sharp price movement, although its direction is not always immediately clear. Despite the asset consolidating within a generally bearish environment, it has commendably maintained its position above the $0.00011 mark. While the Relative Strength Index (RSI) is hovering near 85, indicating an overbought condition and hinting at a potential near-term correction, the strength of the recent bullish rally suggests that any pullback is likely to find support at a comparatively higher level. This scenario would preserve the existing bullish structure, keeping the path open for further upward trajectory.
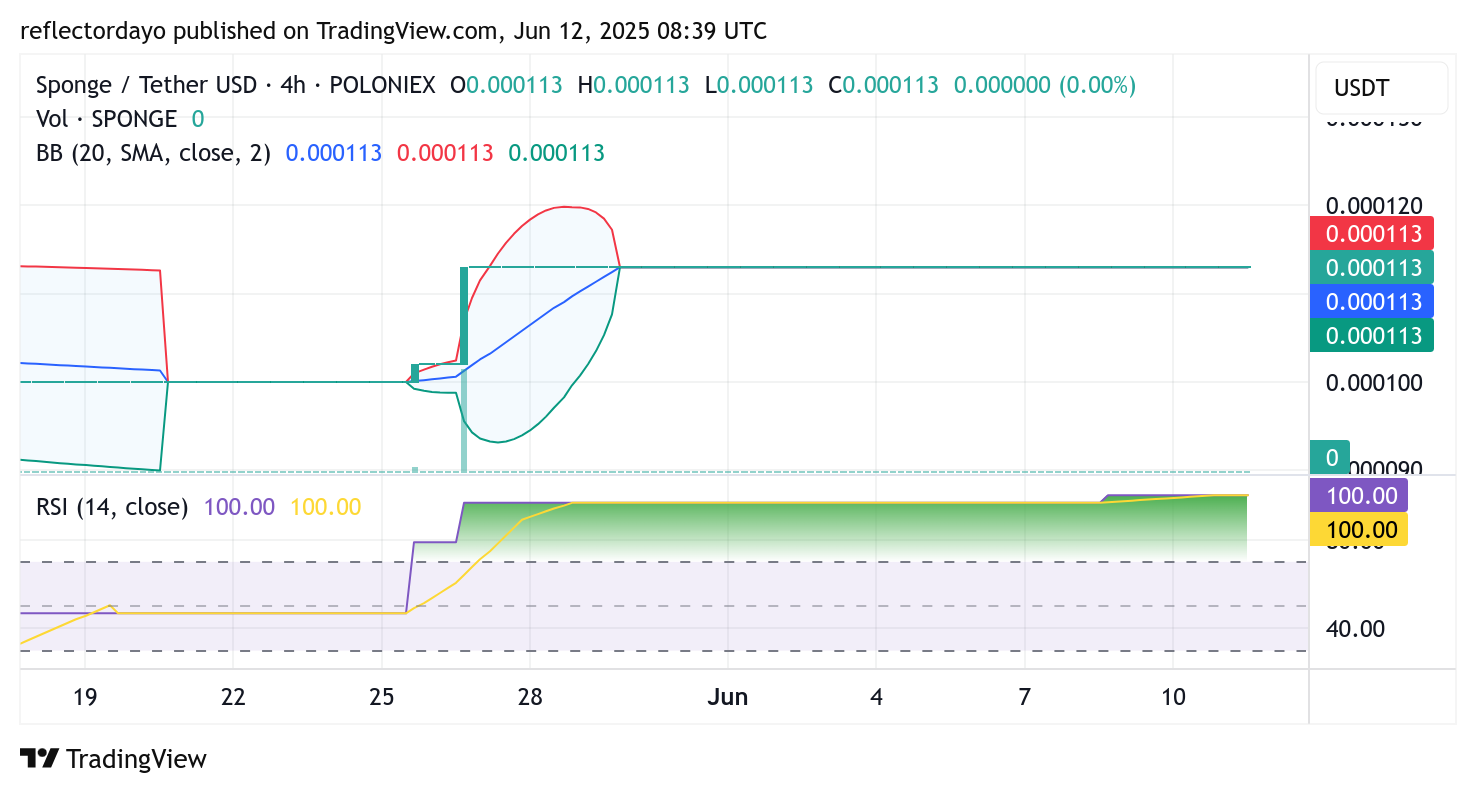
SPONGE/USD 4-Hour Chart: Volatility Squeeze and Peak Momentum Signal Impending Action
Zooming in on the 4-hour timeframe, SPONGE/USD appears primed for an explosive move. The notable compression of the Bollinger Bands is a classic precursor to heightened price volatility. Concurrently, momentum indicators have surged, reaching their maximum reading of 100. This powerful confluence of technical signals points to a high probability of a breakout but also serves as a cautionary flag regarding an overextended market. Should a retracement occur, it could offer fresh opportunities for bulls to establish positions around stronger, higher support zones, thereby ensuring the broader bullish trend remains intact.
Buy SPONGE/USD!
That feeling when you blow another account. IKYK. 💦 pic.twitter.com/PlsEkis7qx
— $SPONGE (@spongeoneth) June 13, 2025
Join the SPONGE community and get in on the next big crypto opportunity! Buy Sponge ($SPONGE) today