ZkSync (ZK/USDT) Faces Strong Sell-offs
Estimated Reading Time: 3 minutes
Don’t invest unless you’re prepared to lose all the money you invest. This is a high-risk investment and you are unlikely to be protected if something goes wrong. Take 2 minutes to learn more

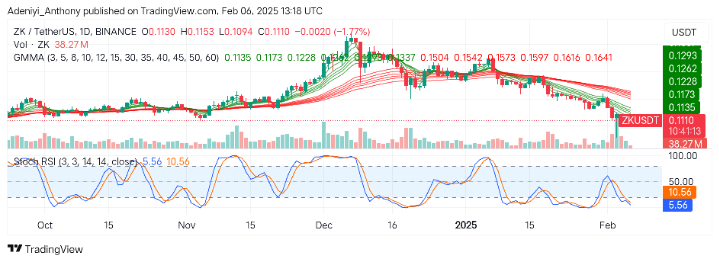
The market for Zksync (ZK) against the Tether (USDT) on the daily chart is showing a clear downtrend since reaching a peak of around $0.1173 in previous sessions. This is an indication that the market is dominated by the bears as it slopes downward.
The Guppy Multiple Moving Averages (GMMAs) signal further price deepening as the bearish crossover condition remains unchanged. However, the Stochastic RSI signals an oversold condition with the probability of a short-term reversal in the near term.
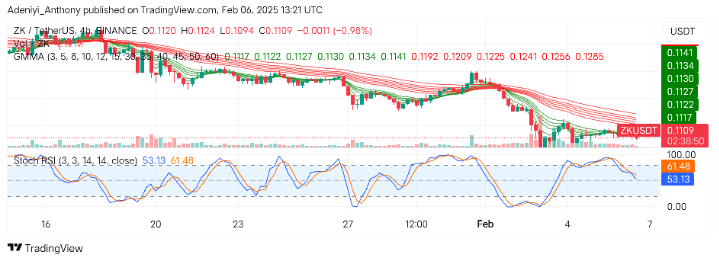
Currently, ZKsync is trading at $0.1110, after recording over 38 million traded volumes and a 1.77% drop in price.
Technical Indicators
Major Resistance Levels: $0.1173, $0.1262, and $0.1293
Major Support Levels: $0.1100, $0.1041, and $0.1000
ZKsync Technical Analysis
The analysis of Zkysnc against the Tether on the daily timeframe shows a pronounced bearish trend. The price has been declining consistently with the formation of lower highs and lows at different stages.
The GMMAs indicate bearish momentum as all the shorter-period moving averages spread beneath the longer-period averages. This confirms strong selling pressure as the price heads southwards.
On the other hand, the Stochastic RSI, which reads below the 15-mark level, signals more pronounced sell-offs with significant volume spikes. However, with the rising sell volume near the support region, a further breakdown could occur as indicators hint at a bearish continuation.
To this end, a break below $0.1100 may lead to another wave of selling pressure; otherwise, a break above $0.1173 is required for a different narrative.
ZK/USDT Analysis: What’s Next?
On the 4-hour chart, ZK/USDT seems to be consolidating after a significant decline; the price seems to be stabilizing around the $0.1100 level. However, the lack of bullish momentum suggests indecision among market participants. The positioning of the GMMAs suggests bearish momentum is slowing down but not fully reversing.
On the other hand, the Stochastic oscillator signals the pair hangs around the neutral position with room for price movement in either direction. To this end, the behavior of the price in the 4-hour timeframe indicates a potential pause in the downtrend, with no clear sign of reversal. However, price reactions around $0.1141 and $0.1100 would determine the next price’s direction.
You can purchase crypto coins here. Buy LBlock