ZKsync (ZK/USDT) Prepares to Settle Above $0.1933
Estimated Reading Time: 3 minutes
Don’t invest unless you’re prepared to lose all the money you invest. This is a high-risk investment and you are unlikely to be protected if something goes wrong. Take 2 minutes to learn more
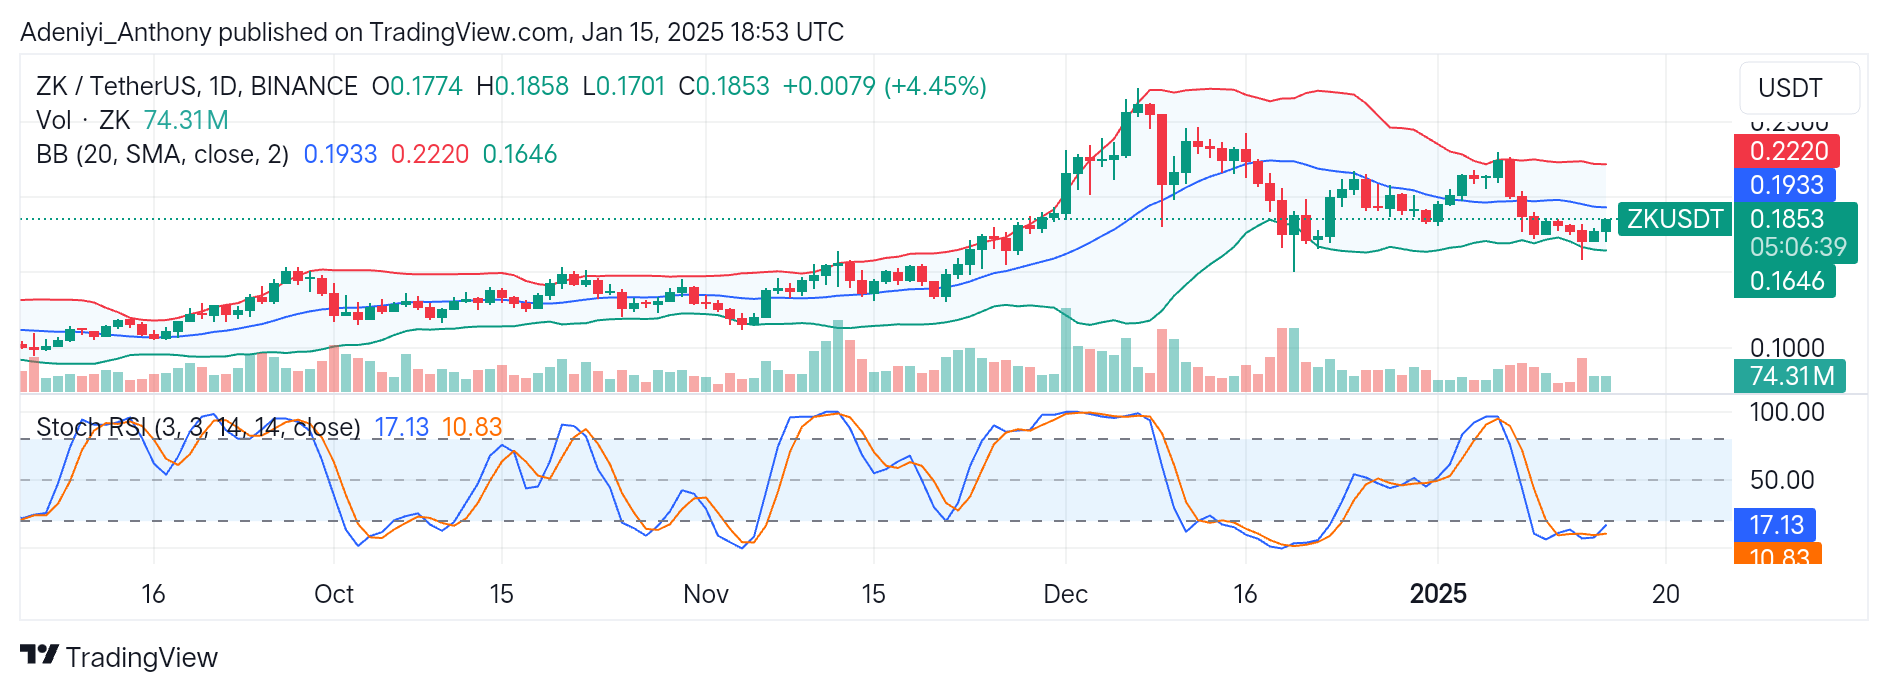
The Zksync against USDT in recent trades has hovered below the midline of the Bollinger band for some days. This suggests the pair has acted under strong selling pressure for some time, with the price now retracing towards the mid-band, showing renewed hope.
However, recent price actions suggest movement towards the $0.1933 critical level as more bullish participants join the market, as indicated by the increasing daily trading volumes.
To this end, as ZK/USDT sees an increase in trading volume, traders are watching for a potential resistance breakout, and trading above the mid-band would trigger more upside shifts to the North.
Currently, ZKsync trades at $0.1853, a 4.45% daily increase over the previous session.
Technical Indicators
Major Resistance Levels: $0.1933, $0.2220, and $0.2500
Major Support Levels: $0.1850, $0.1646, and $0.1500
Zksync Technical Analysis
On the daily timeframe, Zksync against the Tether has recently retraced toward the midline at $0.1933 after testing the lower Bollinger band at $0.1646. However, a breakout above $0.1933 in the near term would pave the way for a movement toward the $0.2220 price level with a spike in trading volume over the 74 million threshold.
On the other hand, the Stochastic RSI shows that the pair is recovering from an oversold situation, suggesting potential for strong bullish momentum. However, failure to hold above the $0.933 mid-band may lead to range-bound activities between $0.1850 and $0.1646.
ZK/USDT Analysis: What’s Next?
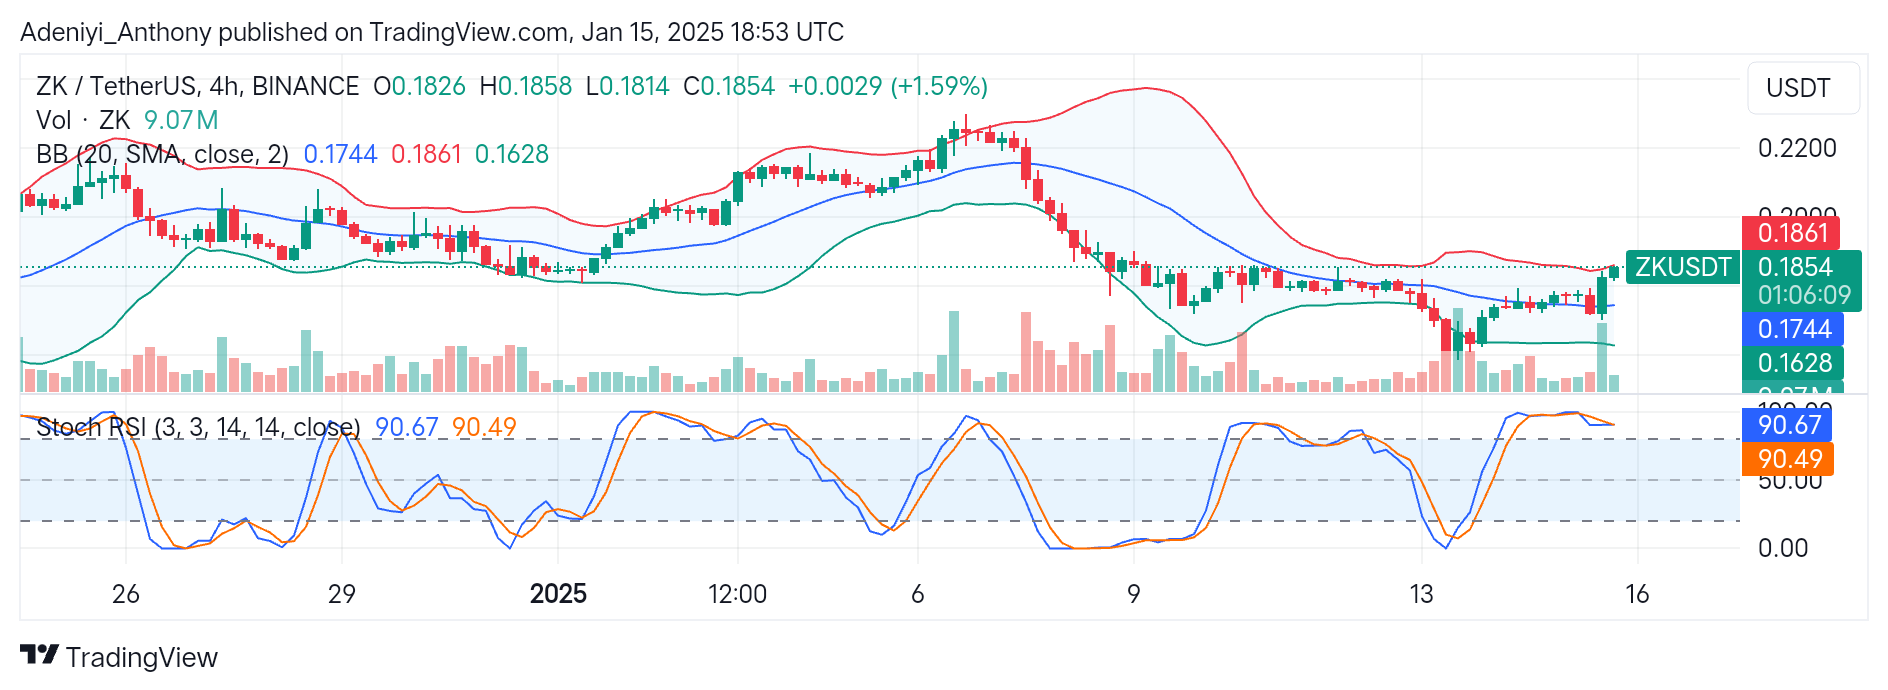
In the 4-hour timeframe, ZK/USDT trades between the upper segment of the Bollinger Bands, indicating building bullish momentum. Contrarily, the overbought Stochastic RSI signals the proposed bullish momentum is waning and a consolidation is in sight.
To this end, as the oscillator moves slightly above the 90-mark level, the possibility of a correction looms. However, a break above $0.1861 could drive the price towards $0.2000 soon.
You can purchase crypto coins here. Buy LBlock