Zksync (ZK/USDT) Poised for a Potential Upside Recovery
Estimated Reading Time: 3 minutes
Don’t invest unless you’re prepared to lose all the money you invest. This is a high-risk investment and you are unlikely to be protected if something goes wrong. Take 2 minutes to learn more

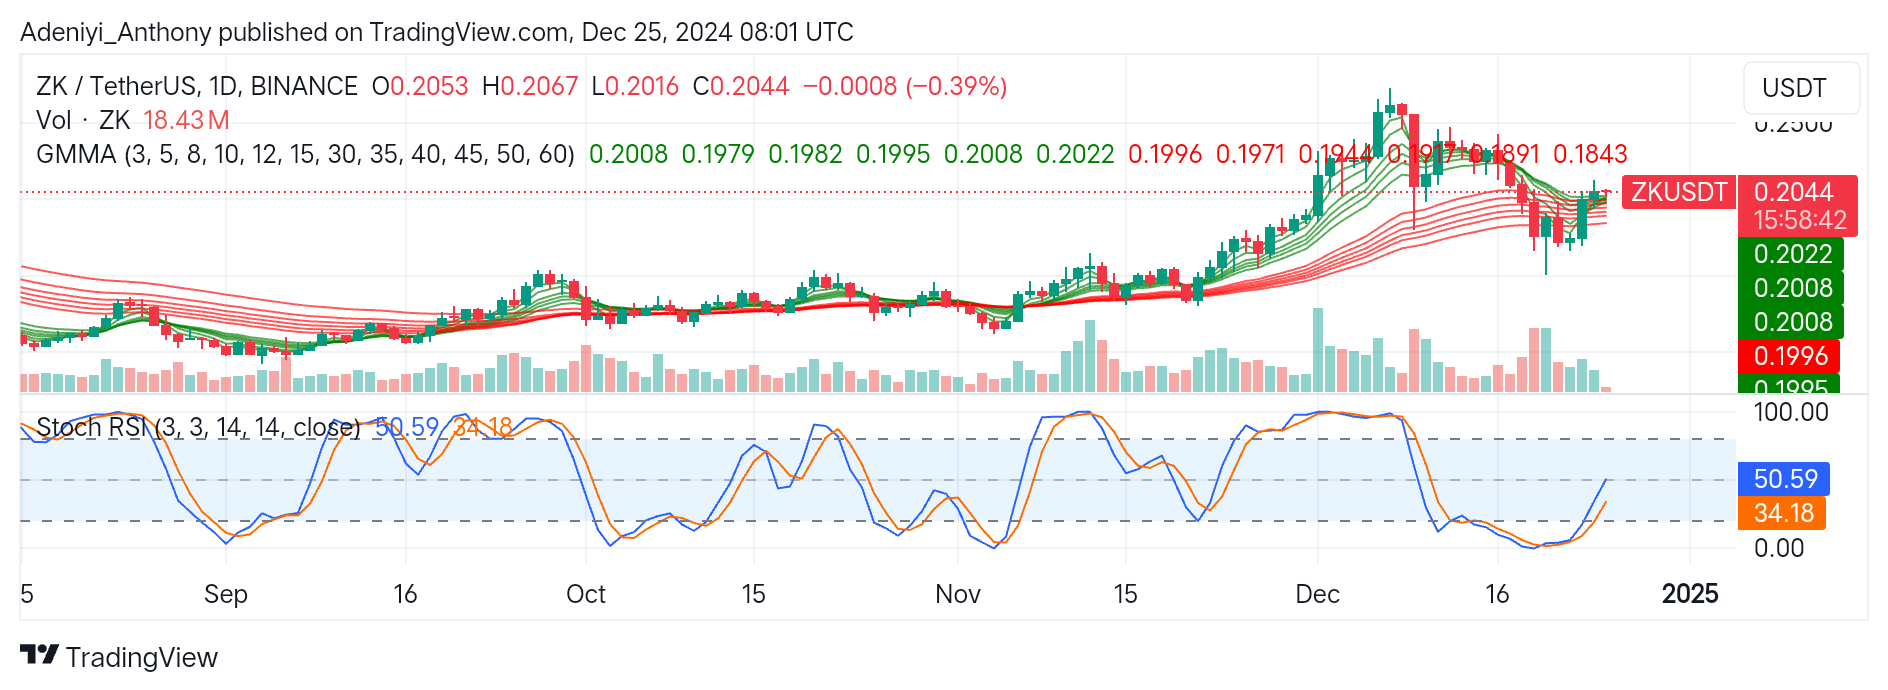
The market for Zksync against the Tether has recently exhibited a mixed sentiment, reflecting a period of consolidation after a sharp decline from a recent all-time high at $0.2300.
Over the weeks, the price has been characterized by increased volatility, with an attempt at recovery after a minor dip within the $0.2000 level.
However, current price movement around the Guppy Multiple Moving Averages (GMMAs) suggests caution as the pair eyes potential recovery toward previous highs.
Currently, Zksync is trading at $0.2044 with over 18 million traded volumes for the day.
Technical Indicators
Major Resistance Levels: $0.2100, $0.2200, and $0.2300
Major Support Levels: $0.2000, $0.1940, and $0.1840
Zksync Technical Analysis
The analysis of Zksync against the Tether on a daily chart shows that the pair is consolidating within a tight range around the short EMAs, suggesting indecision among traders.
The compressed GMMA lines indicate reduced volatility. However, the price action around the lower part of the short EMAs hints at bearish pressure. Therefore, a clear crossover of sets of EMAs and price movement towards $0.2100 would signify a trend reversal.
On the other hand, the Stochastic RSI signals a neutral position for the pair with signs of an upside improvement. At this point, a break to the upside is possible with a spike in trading volume, with an improvement of the Stochastic lines above the 60-mark level; otherwise, the opposite holds.
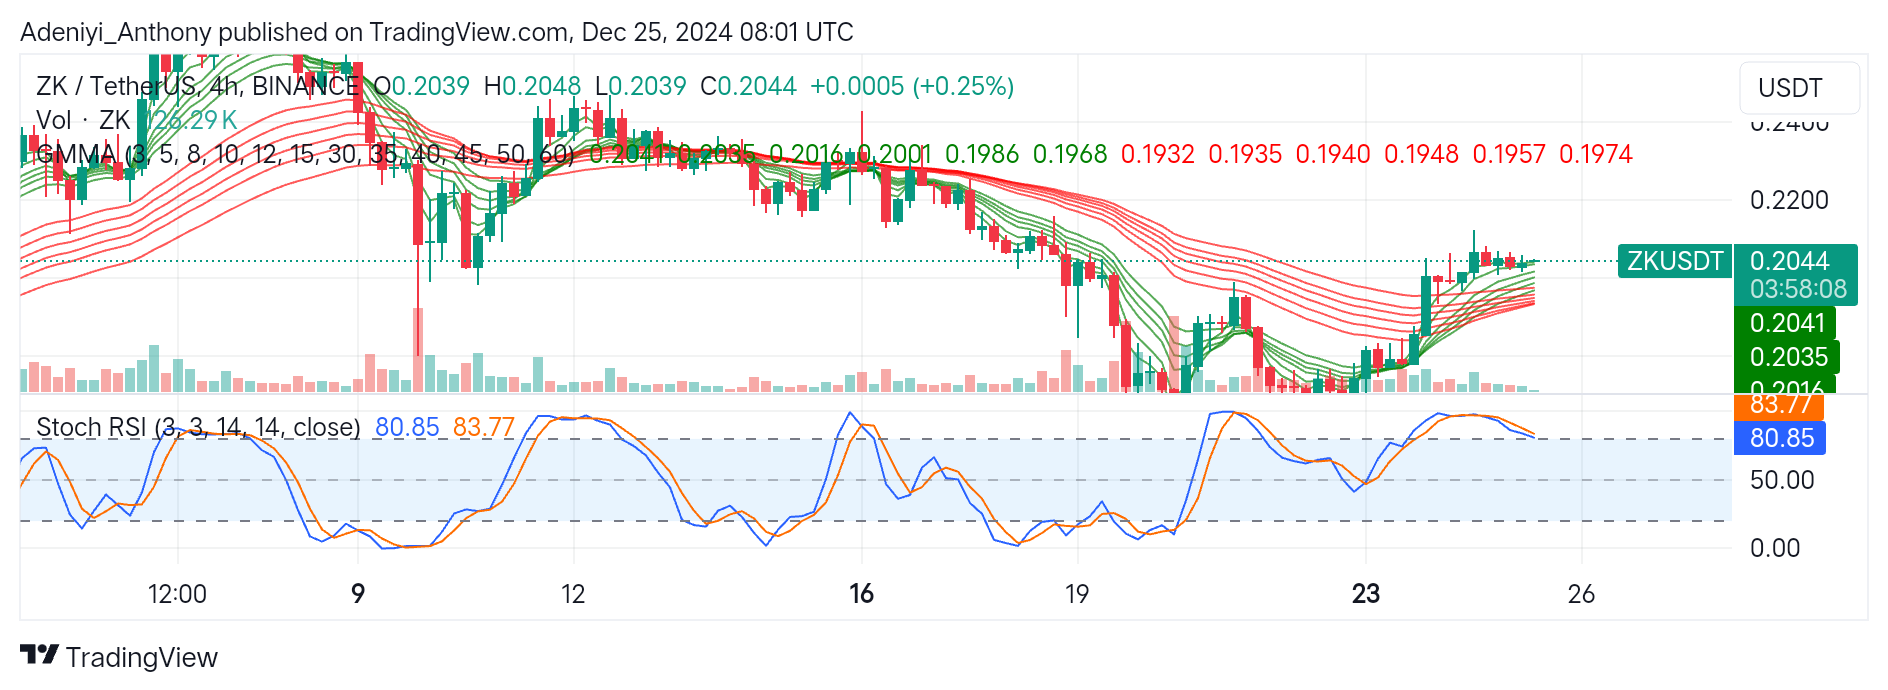
ZK/USDT Analysis: What’s Next?
On the 4-hour timeframe, the analysis of ZK/USDT shows that the price is showing slight upward momentum after a period of consolidation with a little bullish uptick above the GMMAs. This indicates a short-term bullish strength.
On one side, the set of EMAs suggests an upward slope, reinforcing the possibility of a sustained upside movement as the lines begin to spread upward.
On the other hand, the Stochastic oscillator indicator suggests that buying activities may be overextended in the short term.
Therefore, with an increased trading volume, a breakout above $0.2050 may lead to a test of higher resistance. However, if the overbought signal triggers a pullback, the support of around $0.2000 will be a critical level to watch.
You can purchase crypto coins here. Buy LBlock