Zksync (ZK/USDT) Sees Price Dip, Seeks Support Near $0.2014
Estimated Reading Time: 3 minutes
Don’t invest unless you’re prepared to lose all the money you invest. This is a high-risk investment and you are unlikely to be protected if something goes wrong. Take 2 minutes to learn more

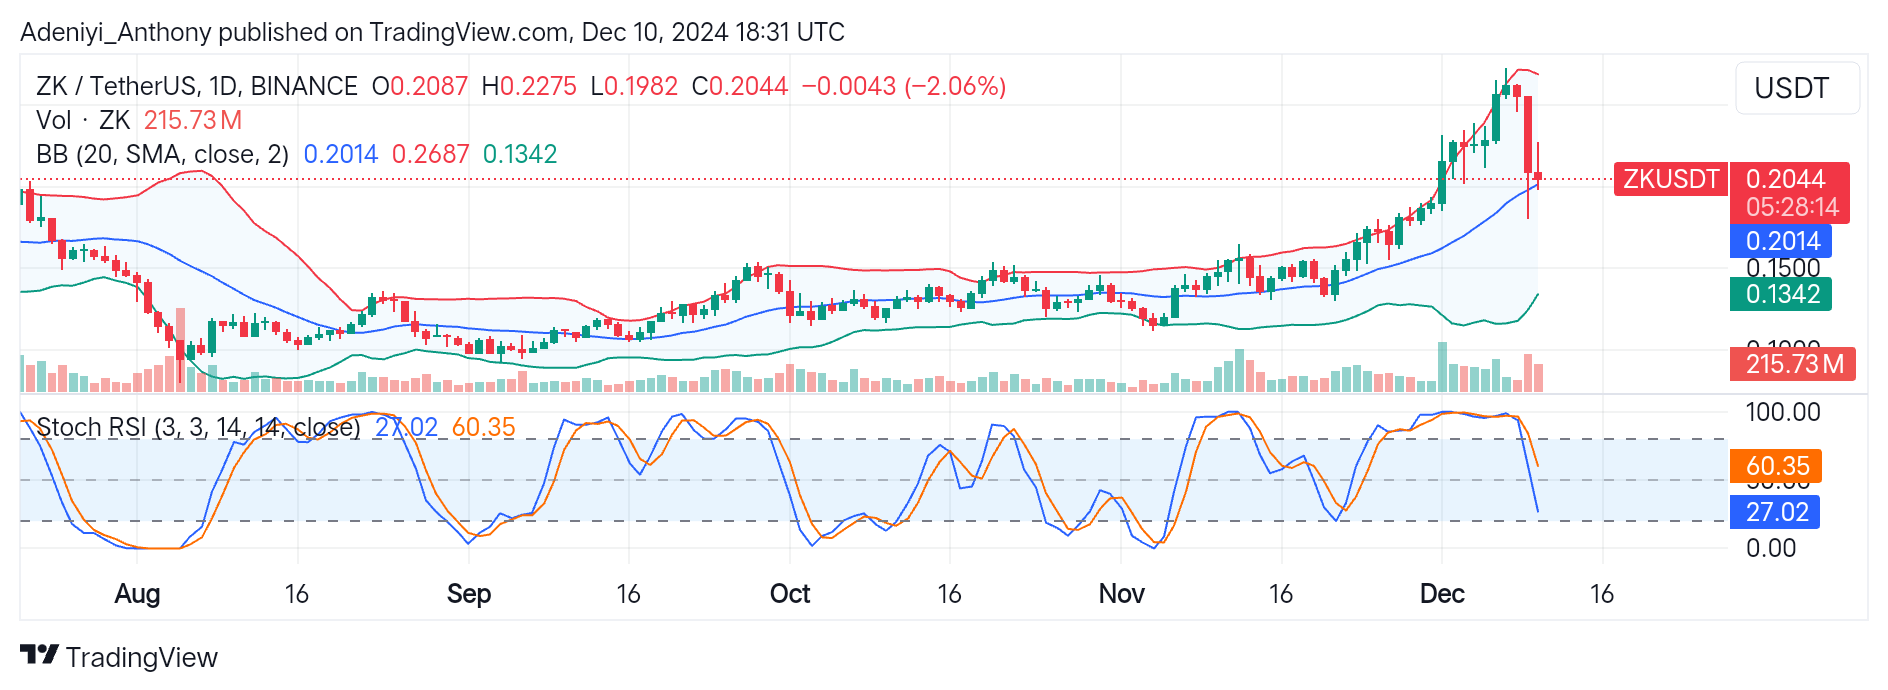
Zksync (ZK) against the Tether (USDT) in recent times has received significant attention as seen in the increased volatility and growing trading volumes. However, the pair has experienced a bullish rally but is now under strong selling pressure. This indicates a shift in sentiment as traders closely monitor $0.2014 to determine ZK/USDT’s next move.
Recently, Zksync was testing the $0.2687 level before retracing to the current level due to mounted selling pressure. However, current price action around the Bollinger mid-band suggests the pair might see an upside correction if the price breaks above $0.2014.
Currently, ZK/USDT trades at $0.2044 with 213.73 million traded volumes for the day, representing a 2.06% decline in trade compared to the previous session.
Technical Indicator
Major Resistance Levels: $0.2275, $0.2687, and $0.3000
Major Support Levels: $0.2014, $0.1500, and $0.1342
Zksync Technical Analysis
The analysis of Zksync on the daily chart suggests the pair is at a crucial point, with the bears testing the strength of recent gains. The recent price action between the upper segment of the Bollinger band suggests decreasing volatility as the lines signal constriction is near. However, the price needs to break above $0.2014 for stabilization; otherwise, a continued dip beyond the mid-band would suggest a further decline.
Furthermore, the Stochastic RSI signals a further downtrend as one of the lines extends into the oversold territory, while the other suspends in the neutral zone. Therefore, to confirm a bullish reversal, there must be a line reversal with the price breaking above the $0.2275 level.
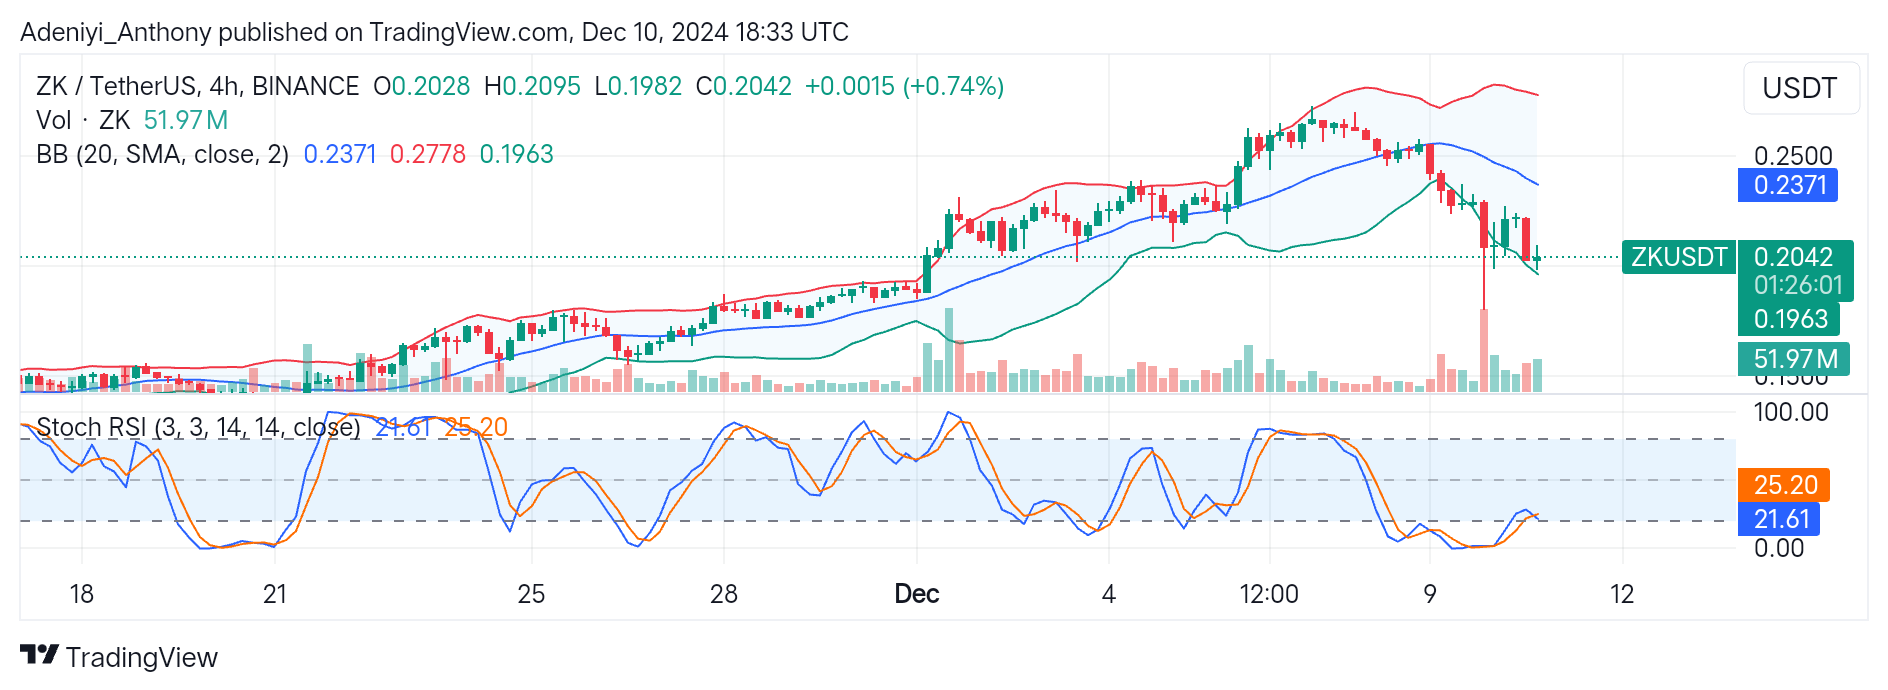
ZK/USDT Analysis: A Potential Bounce or a Continued Downtrend?
On a 4-hour timeframe, ZK/USDT is at a pivotal point as the price tries to rebound from an oversold situation. Accordingly, the recent price near the lower band points to a possible short-term bounce to the upside, while the widening Bollinger band indicates greater market volatility.
To validate this move, the price must break above $0.2237; if it does not, a fall below $0.1963 would signal a continuation of the downward trend. The stochastic oscillator, however, indicates that the pair is oversold and that the selling pressure may soon subside.
As a result, traders would need to focus more on the trading volumes and line behavior when predicting the future direction of ZK/USDT.
You can purchase crypto coins here. Buy LBlock