Wall Street Memes (WSM) Price Shakes, Reshaping Spirals
Estimated Reading Time: 3 minutes
Don’t invest unless you’re prepared to lose all the money you invest. This is a high-risk investment and you are unlikely to be protected if something goes wrong. Take 2 minutes to learn more
Wall Street Memes Price Prediction – March 24
In a way of merely allowing the potentiality of the purchasers of Wall Street Memes cryptocurrency against the market fiat buying power of the US currency, it is showcasing that the base instrument’s price now shakes, reshaping spirals in its positioning output.
Yet, with a bearish signal in the medium-term setup, the oscillating tools depict lighter lower lows, suggesting potential short-term downside pressure despite uncertainties about WSM/USD bears maintaining positions below $0.001 in the long run.
WSM/USD Market
Key Levels
Resistance levels: $0.002, $0.0025, $0.003
Support levels: $0.0008, $0.0006, $0.0004
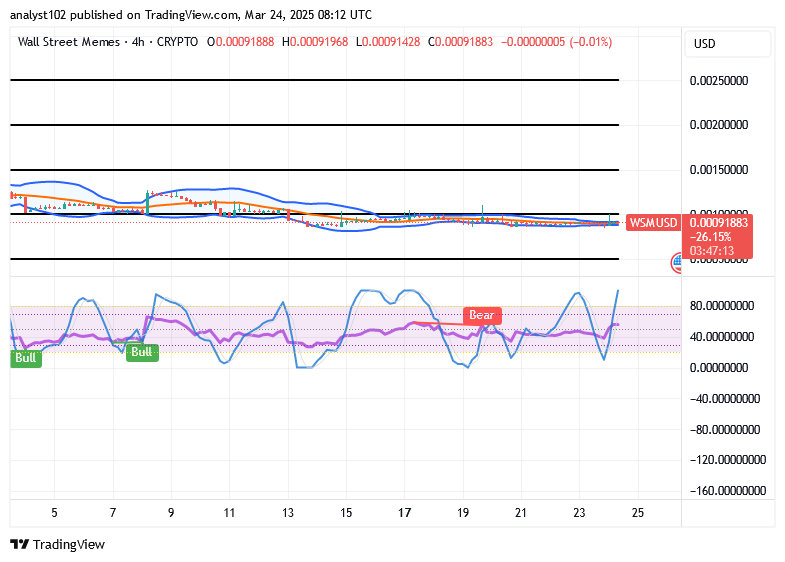
WSM/USD – 4-hour Chart
The medium-term chart of the WSM/USD trade shows that the crypto-economic price shakes on a base, reshaping spirals in the signal inputs.
A recurrence of a series of lighter, smaller-selling candlesticks forming at the threshold of the lower Bollinger Band indicator should steadily reinforce the outlook supporting potential long-entry opportunities in market operations. The stochastic oscillators have remained stable in their swerving movements, indicating the most opportune moment to initiate a buy order—particularly when they begin curving upward after a southbound traversal.
With WSM/USD trading in tight ranges, should new investors wait?
Taking the time that there have been declines in the WSM/USD market operations into consideration until the present moment, the business activities are now getting riper toward gaining ideal momentum as the crypto-economic price shakes, reshaping spirals in its bargaining styles.
As things have been portrayed in terms of observing the pairing instruments running massively in the moon direction, market participants executing long position orders would need to exercise sufficient patience for a confirmed breakout pattern, trend continuation, or volatility expansion to occur subsequently.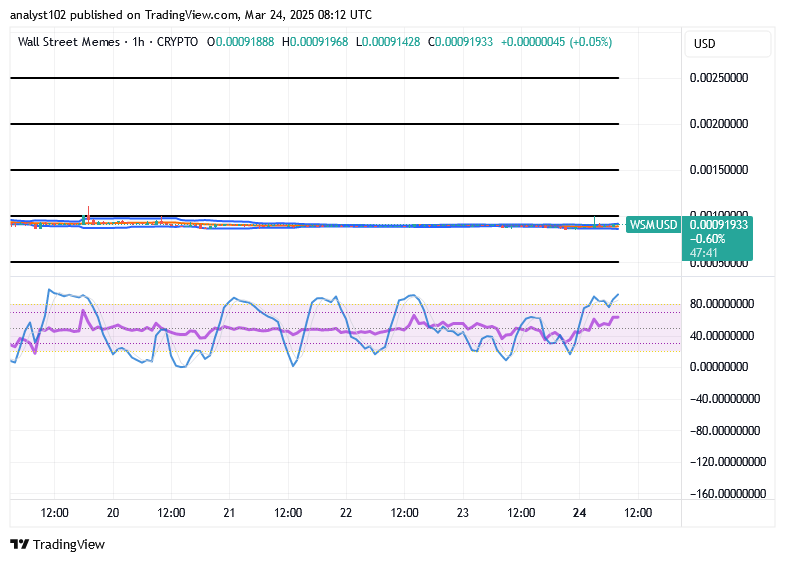
WSM/USD 1-hour chart
The 1-hour chart of the WSM/USD trade is displaying that the short-term running style of the crypto trade now shakes on its baseline, reshaping spirals’ inputs.
The Bollinger Bands’ trend lines have extended eastward, consolidating around the $0.001 value mark. The formation of lightweight candlesticks exhibits varying degrees of bullish potential within a sideways structure. Meanwhile, the stochastic oscillators continue to oscillate steadily between upward and downward swerves, signaling sustained market participation and activity.
We emphasize that the Wall St Memes team will never initiate direct messages or request personal information from you.
Over the last 24 hours, The $WSM token and community has undergone a coordinated attack. The hackers specifically targeted our Discord community.
— Wall Street Memes (@wallstmemes) October 12, 2023
We reiterate that no one from the Wall St Memes team will ever direct message you first, or ask for any personal information – even… pic.twitter.com/VwySpXC7cz