Wall Street Memes (WSM) Market Bounces, Rebuilding Catalysts
Estimated Reading Time: 3 minutes
Don’t invest unless you’re prepared to lose all the money you invest. This is a high-risk investment and you are unlikely to be protected if something goes wrong. Take 2 minutes to learn more
Wall Street Memes Price Prediction – March 23
There have been activities to show that variant smaller lower lows have to occur slightly below the trade line of $0.001, as the Wall Street Memes coin is equally bouncing in its signal inputs, rebuilding catalysts in the proceedings.
As observed, selling price responses are not gaining sufficient momentum to establish a formidable cycle for sustained dominance. In light of this trade bias, it remains technically evident that long-term position movers will likely prevail in the upcoming volatile sessions, as the WSM/USD market continues its trend reversal toward the upside after probing for an all-time low.
WSM/USD Market
Key Levels
Resistance levels: $0.002, $0.0025, $0.003
Support levels: $0.0008, $0.0006, $0.0004
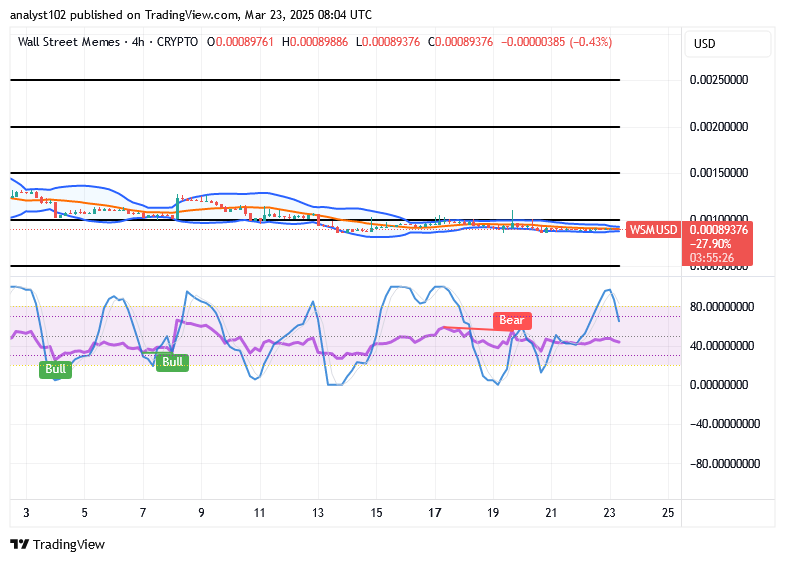
WSM/USD – 4-hour Chart
The medium-term chart of the WSM/USD trade showcases that the crypto-economic market is also bouncing in its movements, rebuilding catalysts’ weight.
The absence of a stable bullish candlestick forming decisively above the Bollinger Bands trend lines has caused the trading pair to gradually establish lighter lower lows near the lower threshold of the indicators. Meanwhile, the stochastic oscillators continue to fluctuate across various levels under a weak bearish setup, mitigating the likelihood of a sustained downward movement in the long-term trend.
Given the oscillators’ bearish signal within the medium-term structural framework, is the WSM/USD market positioned for an unrestrained downward continuation in subsequent sessions?
Free fall-offs on a higher note are not expected to surface there from, as the WSM/USD market has been closely noticed to be bouncing in the way of its movement against the US dollar, given that it has rebuilding catalysts.
It would still be a strategic opportunity window for long-term trading capitalists to latch onto the situation by not nursing any fear of adding more points to their investment portfolio sizes, considering the positioning of the moving averages, stochastic oscillators, and Fibonacci retracement levels in order to benefit maximally from the long-presumed rebounding cycle and potential bullish breakout afterward.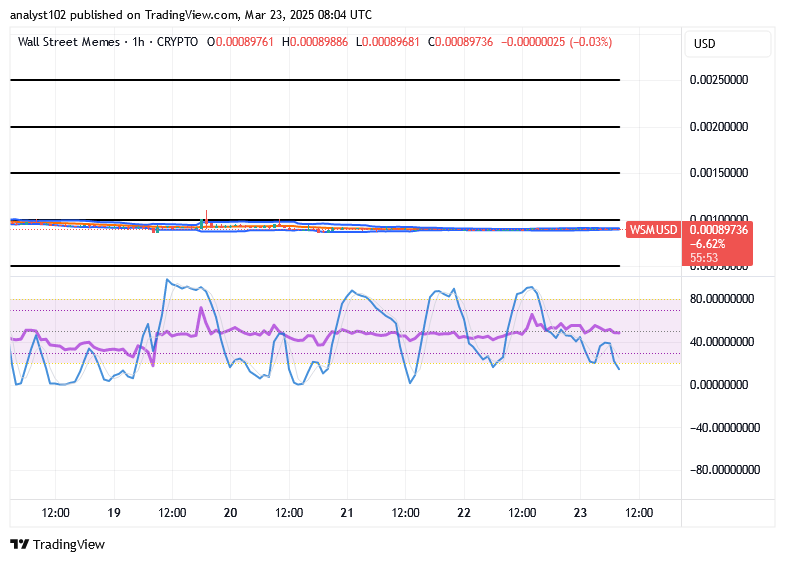
WSM/USD 1-hour chart
The 1-hour chart of the WSM/USD trade is showcasing that the short-term running style of the market is bouncing, rebuilding catalysts at a lower spot.
As of this analysis, a series of lighter candlesticks has emerged around the $0.00089736 price level, aligning with the lower Bollinger Bands as the primary threshold zone. Meanwhile, the stochastic oscillators are on the verge of dipping into the oversold region, indicating that selling pressure is at risk of diminishing.
Explore fresh trading opportunities with 1-25x leverage. Plus, they’re now available on Bybit Futures Grid Bot! Get started today.
🚀 BIGTIMEUSDT & WSMUSDT Contracts now on Bybit!
— Bybit (@Bybit_Official) October 12, 2023
Dive into new trading opportunities with 1-25x leverage. Plus, they’re now on Bybit Futures Grid Bot! Start trading now.
📈 BIGTIME: https://t.co/FAQlbhnzAh
📈 WSM: https://t.co/pb2y2AfMBE#CryptoTrading #Bybit

