Wall Street Memes (WSM) Trade Keeps a Base, Adding Rises
Estimated Reading Time: 3 minutes
Don’t invest unless you’re prepared to lose all the money you invest. This is a high-risk investment and you are unlikely to be protected if something goes wrong. Take 2 minutes to learn more
Wall Street Memes Price Prediction – March 21
The regeneration of price activities, showcasing that long-term position movers will steadily gain momentum, has continued to take shape in the operations of the Wall Street Memes coin against the valuation of the US currency. The current market trend suggests that the crypto-economic trade is maintaining a base while gradually adding rises.
At the moment of this analytics, it is demonstrated that long-term position movers will probably hold stronger, building up muscles on the threshold of the lower Bollinger Band indicator. The oscillating indicators have slightly swerved northbound, suggesting an imminent shift in momentum.
WSM/USD Market
Key Levels
Resistance levels: $0.002, $0.0025, $0.003
Support levels: $0.0008, $0.0006, $0.0004
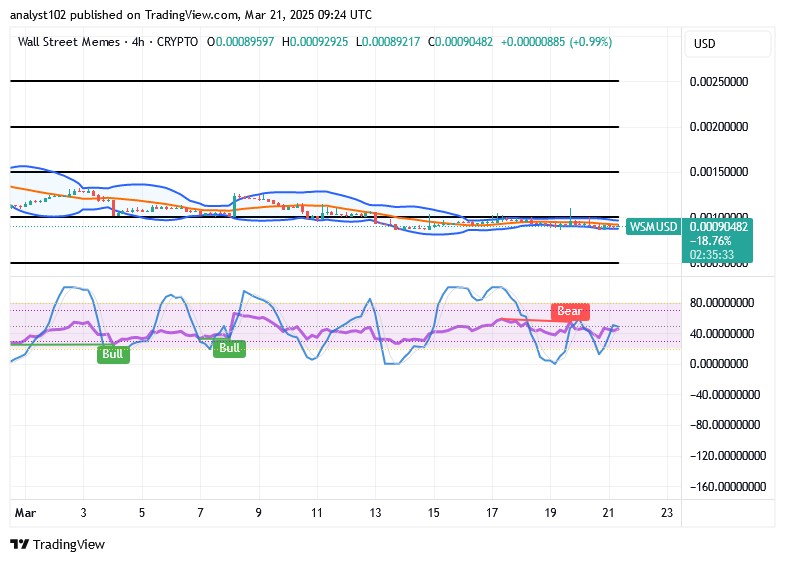
WSM/USD – 4-hour Chart
The medium-term chart of the WSM/USD trade shows that the crypto-economic market keeps a base formation, adding rises.
The trajectory of the stochastic oscillators indicates a weak bearish signal developing below the 80 level. Simultaneously, the Bollinger Bands’ trend lines continue to extend eastward around the $0.001 price zone, reinforcing the prevailing market consolidation phase.
As there has been a bearish-driven signal as depicted by the oscillators, should the WSM/USD market sellers begin going southbound from $0.001?
We do not expect to see reliable further downs away from $0.001 in the sessions to come after today’s cycle, given that the WSM/USD trade keeps a base pattern, adding rises.
Executing long position orders should persist without hesitation, as the long-anticipated massive rebound remains a viable prospect. In this context, retaining accumulated positions remains the most strategic approach, particularly given that the base instrument has consistently maintained a basement-level trajectory along the lower thresholds of the Bollinger Bands indicators over an extended period.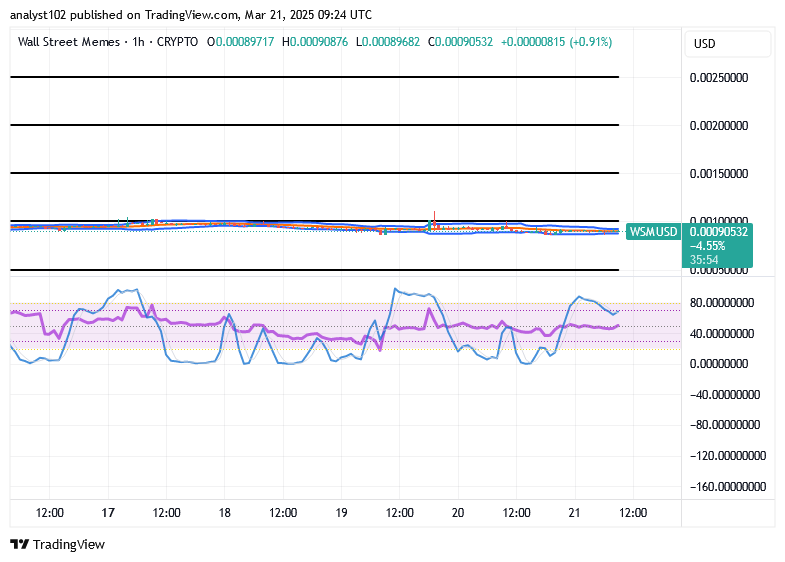
WSM/USD 1-hour chart
The 1-hour chart of the WSM/USD trade reveals that the crypto-economic trade keeps a base-making style around $0.001, adding rises
The Bollinger Bands indicators are in a mood of merely bending down around the point of $0.001, briefly showcasing that a sense of a shape toward getting decent longing entries has been formulated. The stochastic oscillators have been freely pushing ups and downs to involve both oversold and overbought areas, with most signals being bullish.
A classic meme… yet it feels more relevant than ever.
Old meme … but it seems more accurate than ever pic.twitter.com/dDmpFCZyFX
— Wall Street Mav (@WallStreetMav) October 6, 2024