Wall Street Memes (WSM) Price Holds Firmly, Nurturing Spirals
Estimated Reading Time: 3 minutes
Don’t invest unless you’re prepared to lose all the money you invest. This is a high-risk investment and you are unlikely to be protected if something goes wrong. Take 2 minutes to learn more

Wall Street Memes Price Prediction – March 20
There has been a degree of consistency in the moods that the WSM market bulls have been pairing muscles with the USD trade sellers, as the present financial situation reveals that the price holds firmly, nurturing spirals in its input.
The prevailing trend of the lower Bollinger Band indicator has established a strong signal, affirming that the ideal re-buying cycle remains active at the time of this analysis. Long-term position holders should maintain their stance, refraining from hesitating to increase their orders, as the anticipated bullish rebounds are technically poised to materialize imminently.
WSM/USD Market
Key Levels
Resistance levels: $0.002, $0.0025, $0.003
Support levels: $0.0008, $0.0006, $0.0004
WSM/USD – 4-hour Chart
The medium-term chart of the WSM/USD trade showcases that the crypto-economic market now holds firmly, nurturing spirals in their signal output.
The foundational candlestick formations along the lower Bollinger Band indicator have been largely influenced by a sequence of prospective bullish movements, while the overall structure maintains an eastward trajectory. The stochastic oscillators exhibit a consistent northbound swerving pattern from the oversold region, remaining below the 80-point threshold. This reinforces the notion that accumulation phases are gaining increased market focus.
As the WSM/USD market is prevalent in ranges around $0.001, is it still ideally logical for buyers to hold to their thoughts?
It is still in line with the principles of technical analysis to continue executing buying positions, as the WSM/USD market holds firmly, nurturing spirals in its signal settings.
A slight steady occurrence of touches has been practically demonstrated in the operations of the Wall Street Memes coin, signifying that the power currently held by the American currency around the point of $0.001 is encountering resistance within the dynamic support zones, aligning with Fibonacci retracement levels and trend line confluences.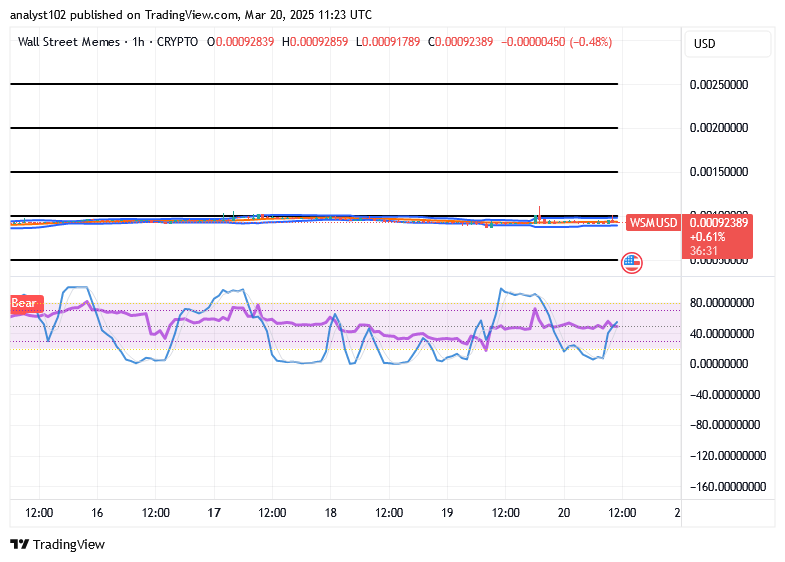
WSM/USD 1-hour chart
The 1-hour chart of the WSM/USD trade mirrors that the crypto-economic trade currently holds firmly, nurturing spirals.
It has been a kind of mixed set of lighter lower ups and downs that have dominated the eastward stretches of the trend lines of the Bollinger Bands. And they are featured around the point of $0.001. The stochastic oscillators yet remained freely swerving through variant points under the mere bearish setup.
Dog wif sacrificed his hat to seize the dip.
Dog wif sold his hat to buy the dip pic.twitter.com/Ry4WdAvmlg
— Wall Street Memes (@wallstmemes) February 25, 2025