UNUS SED LEO Price Prediction: LEO/USD Drops Sharply Below $3.91 Resistance
Estimated Reading Time: 3 minutes
Don’t invest unless you’re prepared to lose all the money you invest. This is a high-risk investment and you are unlikely to be protected if something goes wrong. Take 2 minutes to learn more
UNUS SED LEO Price Prediction – August 21
The UNUS SED LEO price prediction shows that LEO may recover from the recent low of $3.70 but bulls may have trouble pushing the price to the upside.
LEO/USD Long-term Trend: Ranging (Daily Chart)
Key levels:
Resistance Levels: $4.30, $4.40, $4.50
Support Levels: $3.40, $3.30, $3.20
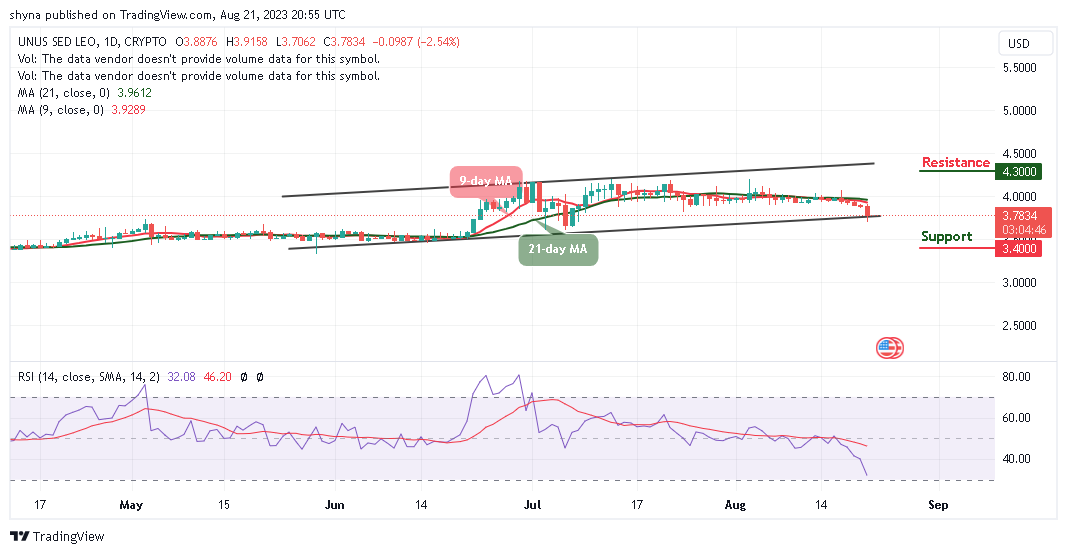
At the time of writing, LEO/USD is trading down by 2.54% at its current price of $3.78. The coin has been facing a downward movement for the past few days, with the selling pressure sliding toward the lower boundary of the channel. Moreover, where the coin may go next could depend on whether or not bulls can take control of it before it breaks below $3.70 or $3.60.
UNUS SED LEO Price Prediction: Any Hope to Trade Higher?
The UNUS SED LEO price is likely to face sellers near the $3.75 support zone. Meanwhile, a clear close below this level could most likely start a strong selling pressure. However, the next target for the bulls could be above the 9-day and 21-day moving averages at $4.10 in the near term. Therefore, any more gains could lead the price toward the $4.30, $4.40, and $4.50 resistance levels.
Nevertheless, if the UNUS SED LEO price fails to clear the $3.90 resistance, it could correct lower. The first key support may be located around the $3.76 level. The main support could be found below the lower boundary of the channel. Any more losses might call for a test of the $3.50 support level. If the bulls fail to defend the $3.78 support zone, the price is likely to hit the support levels of $3.40, $3.30, and $3.20 respectively. The technical indicator Relative Strength Index (14) is likely to cross below the 30-level, suggesting more bearish signals into the market.
LEO/USD Medium-Term Trend: Ranging (4H Chart)
On the 4-Hour chart, LEO price hovers around $3.78 and may take time to trade above the resistance level of $3.80. However, if the bulls gather enough strength and regroup, the upward movement may be able to near the potential resistance level of $3.90 and above.
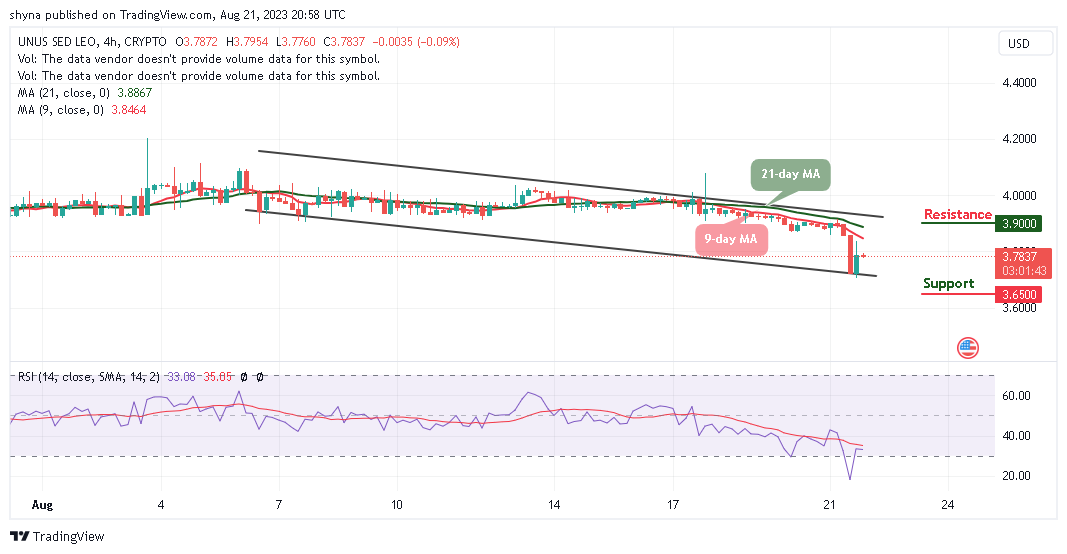
On the downside, immediate support is below the lower boundary of the channel as the main support level could be found at $3.65 and below. Technically, the UNUS SED LEO price is likely to move sideways as the technical indicator Relative Strength Index (14) moves below the 30-level, indicating an indecisive market movement.
Place winning LEO trades with us. Get LEO here