Wall Street Memes (WSM) Trade Shapes Basis, Settling for Spikes
Estimated Reading Time: 3 minutes
Don’t invest unless you’re prepared to lose all the money you invest. This is a high-risk investment and you are unlikely to be protected if something goes wrong. Take 2 minutes to learn more

Wall Street Memes Price Prediction – March 19
As there have been a series of lighter ups and downs going on in the transactions of the Wall Street Memes coin versus the purchasing spree of the USA currency, the overall output yet portends that the accumulation of the base instrument should be given top-notch, as the crypto-economic trade shapes the basis, settling for spikes.
Over the past few sessions, technical indications do not favor sellers capitalizing on downward movements, as the market is tactically positioning itself to gain substantial strength, potentially triggering a significant bounce-off shortly. This reinforces the probability that long position orders will establish formidable stances, supporting a bullish outlook.
WSM/USD Market
Key Levels
Resistance levels: $0.002, $0.0025, $0.003
Support levels: $0.0008, $0.0006, $0.0004
WSM/USD – 4-hour Chart
The medium-term chart of the WSM/USD trade reveals that the crypto-economic price shapes the basis, settling for spikes in inputs.
A consistent formation of lower highs in the candlestick patterns along the lower Bollinger Band indicates a favorable environment for initiating long positions. The stochastic oscillators have dipped southward into the oversold region, suggesting that further bearish momentum beyond the $0.001 level would require significant selling pressure, which appears unlikely in the near term.
Has there been any indication to back more declines against the lower Bollinger Band seeing the WSM/USD market hovering around $0.001?
Most of the candlesticks being featured in their smaller lengths have continued to carry variant promissory increasing motes as the WSM/USD market is fluctuating around $0.001, given that the crypto-economic trade shapes the basis, settling for spikes.
A slight gap has formed just below the middle Bollinger Band trend line, indicating that long-term position holders are intensifying efforts to establish stronger footing against the purchasing power of the counter-trading instrument. Position accumulation proceedings should remain active, as the market has yet to regain aggressive momentum, potentially setting the stage for a significant price shift.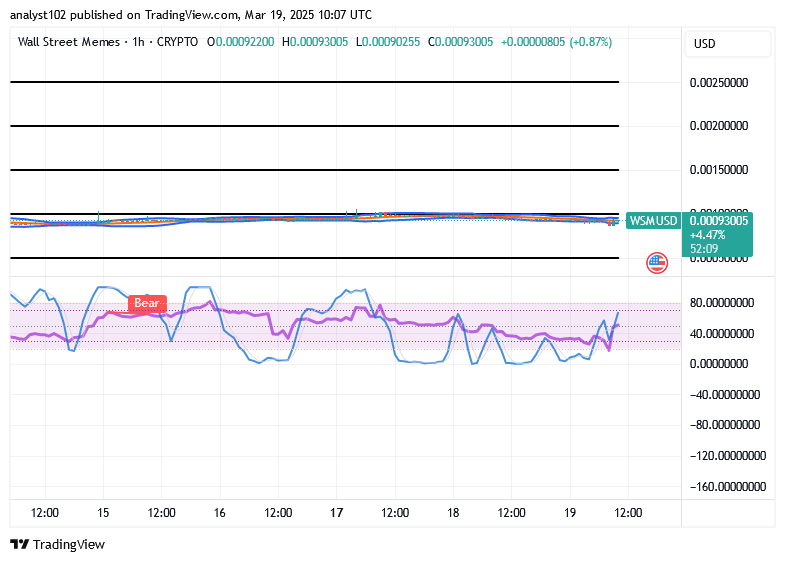
WSM/USD 1-hour chart
The 1-hour chart of the WSM/USD trade mirrors that the crypto-economic trade shapes the basis, settling for spikes.
Consistent placement images have demonstrated that the Bollinger Bands’ trend lines are positioned eastward around the $0.001 value lines. In order to indicate that certain upward moves are likely to be sustained in the near future, the stochastic oscillators are swerving.
How cryptocurrency guys behave after spending $10 to purchase the dip.
How crypto bros act after buying the dip with $10 pic.twitter.com/lJa3yvYRYf
— Wall Street Memes (@wallstmemes) March 16, 2025