Wall Street Memes (WSM) Price Sets Basis, Waxing Energy
Estimated Reading Time: 3 minutes
Don’t invest unless you’re prepared to lose all the money you invest. This is a high-risk investment and you are unlikely to be protected if something goes wrong. Take 2 minutes to learn more

Wall Street Memes Price Prediction – March 18
There have been systemic ways of letting the WSM/USD market purchasers thrive on most of the moves being featured in the trade activities that show a mere chance toward seeing sellers driving the movements to the downside, given that the crypto-economic price sets basis, waxing energy in the signal inputs.
It is indicated that the oscillating tools are technically positioned to push in a bid to signify the possibility of establishing a formidable support point, setting the stage for an imminent upward swing. In a notable way of complementing that sentiment, a consistent horizontal trajectory has persistently formed along the lower Bollinger Band, reinforcing the likelihood of a potential rebound in the near term.
WSM/USD Market
Key Levels
Resistance levels: $0.002, $0.0025, $0.003
Support levels: $0.0008, $0.0006, $0.0004
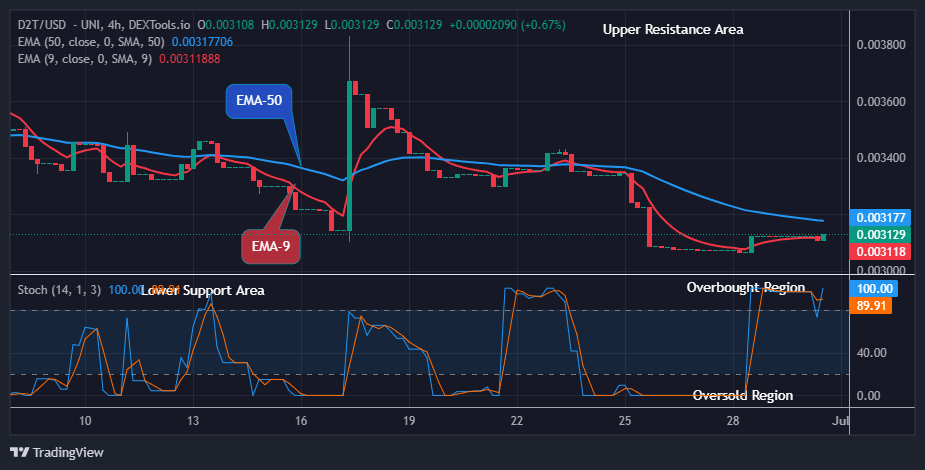
WSM/USD – 4-hour Chart
The medium-term chart of the WSM/USD trade showcases that the crypto-economic price sets a basis, waxing energy in most moving inputs.
Considering the extreme positioning postures of the trend lines of the Bollinger Bands indicators, it is burning out that the price movements’ pattern is in volatile consolidation ranges. The stochastic oscillators are tentatively reshaping northbound slanting across the critical support point of 40.
With the repositioning order of the Bollinger Bands around $0.001, will the WSM/USD market lose more values there?
It is possible to still see more little declines in the operations of the WSM/USD market in order to further purpose a delay tactic in the vein of securing more strength toward sudden rebounds, given that the crypto-economic trade sets a basis, waxing energy in its inputs.
Regaining ideal pushing power is at the extreme baseline of gaining bullish impulses in the pricing actions. The bargaining situation has only been made in such a way to practice strategic patience, as the long-term position movers are liable to hold firmly around the accumulation pathway of the lower Bollinger Band before initiating a potential breakout.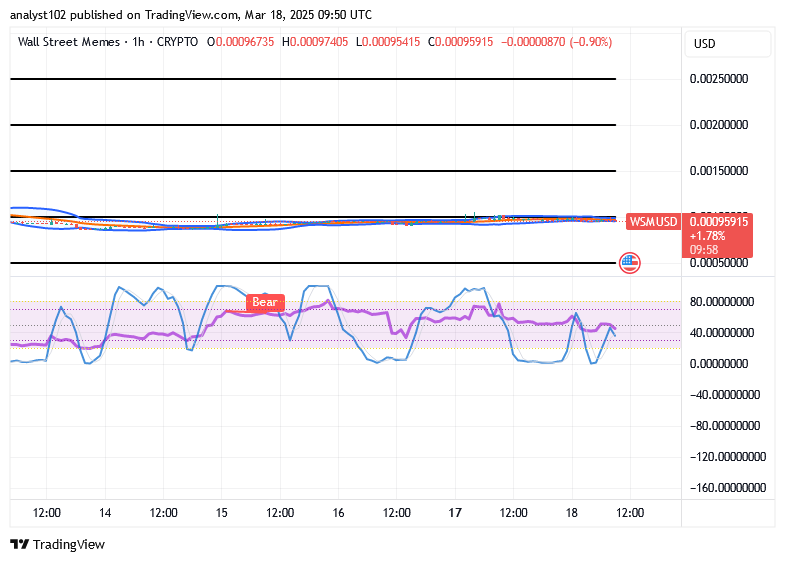
WSM/USD 1-hour chart
The 1-hour chart of the WSM/USD trade showcases that the crypto-economic market sets a basis, waxing energy in its inputs.
It has practically been indicated by the stochastic oscillators from the hourly perspective that the setup of the stochastic oscillators showcases a feeble bearish output with low volatility and declining momentum. The Bollinger Bands trend lines have remained stretched eastward to affirm that a series of sideways price actions, accumulation phases, and consolidation zones are in the making.
Me: snaps up the dip.
Chart a split second later:
Me: *buys the dip*
— Wall Street Memes (@wallstmemes) March 15, 2025
Chart 0.001 seconds later: pic.twitter.com/DObzO1b7Sq