Uniswap (UNI) Price Prediction: Uniswap Acquires Higher Support
Estimated Reading Time: 3 minutes
Don’t invest unless you’re prepared to lose all the money you invest. This is a high-risk investment and you are unlikely to be protected if something goes wrong. Take 2 minutes to learn more

Uniswap (UNI) Price Prediction: May 30
Price action in the Uniswap market was able to gather enough momentum to escape the gravitational pull below the $8.00 resistance line. This happened ten sessions ago. Since then, the market has been making higher highs, as the current session suggests that another support level has been reached.
UNI/USDT Long-term Trend: Bullish (Daily Chart)
Key Levels:
Resistance Levels: $12.00, $14.00, and $16.00.
Support Levels: $10.00, $8.00, and $6.00.
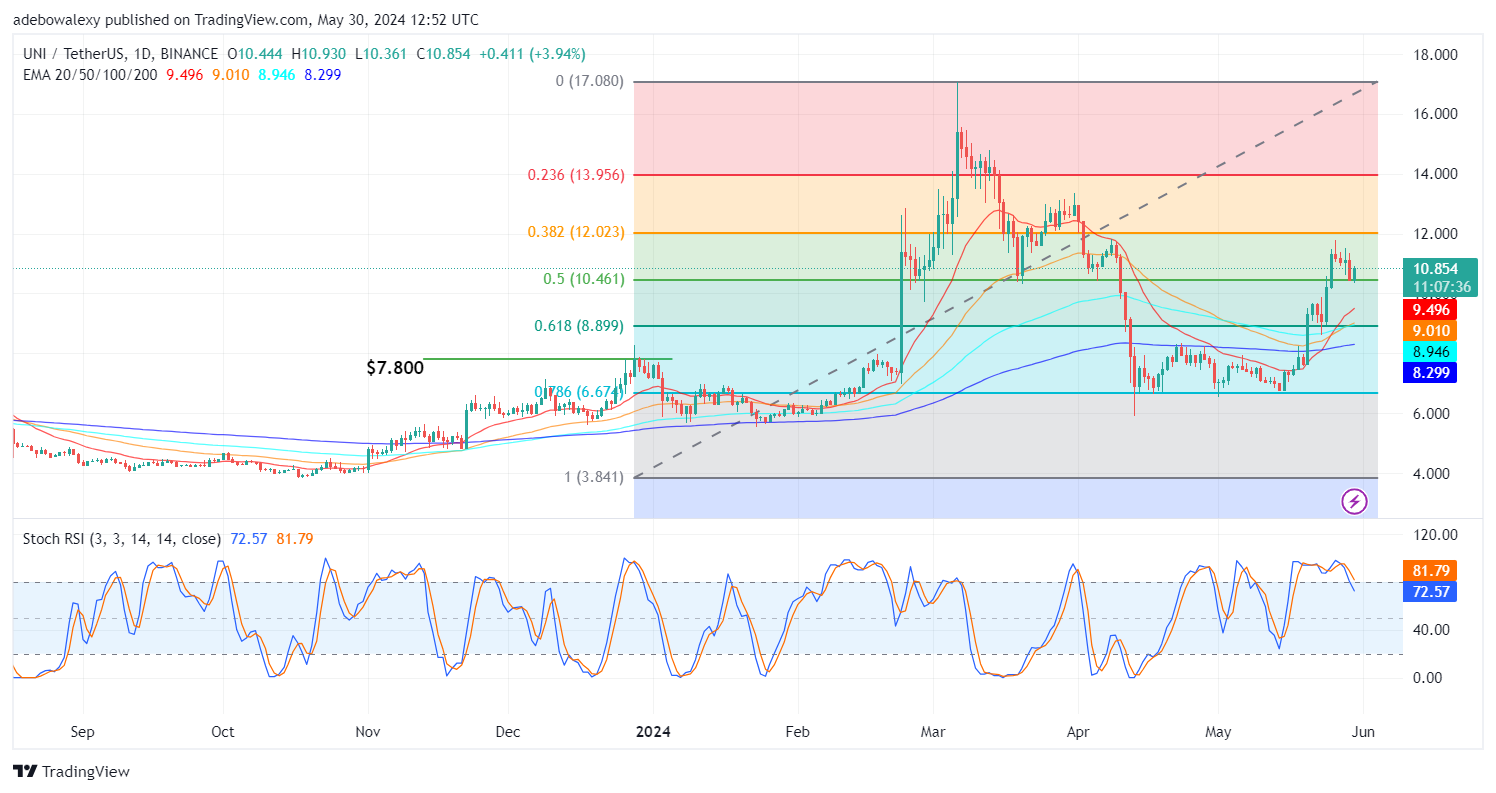
The current session on the Uniswap daily price chart can be seen standing at the 50% Fibonacci Retracement level. Also, the color of this price candle suggests that upside forces may have resumed action. Trading activity in this market is occurring above all the Exponential Moving Average (EMA) curves on the chart. However, the Stochastic Relative Strength Index (SRSI) presents a different view of the market as the lines of this indicator continue to trend downward towards the 70 level of the indicator.
Uniswap Price Prediction: Can Bulls in the UNI/USDT Market Charge Higher?
For what it’s worth, it’s good to see price action break free from the gravitational pull below the $8, $9, and even $10 price regions. In subsequent sessions, we have seen the market make higher highs. The current session has demonstrated that buyers are already making another stand at a higher and more meaningful mark on the Fibonacci Retracement Tool.
The 50% level of the Fibonacci Retracement tool may offer more strength to upside forces, increasing the chance of a continued upside retracement. This stand can also be seen occurring above all the EMA lines, suggesting that the upside move may still be ongoing at this point. This conclusion can be drawn despite the bearish opinion of the SRSI indicator.
UNI/USDT Medium-term Trend: Uniswap Bulls Are Making the Right Moves (4H Chart)
Price activity in the UNI 4-hour market can be seen rising upward above the upward-sloping trendline on the chart. Meanwhile, it can be seen that the last price candle has resurfaced above all the EMA lines. Simultaneously, we can see that the SRSI indicator lines are trending upward from the oversold region.
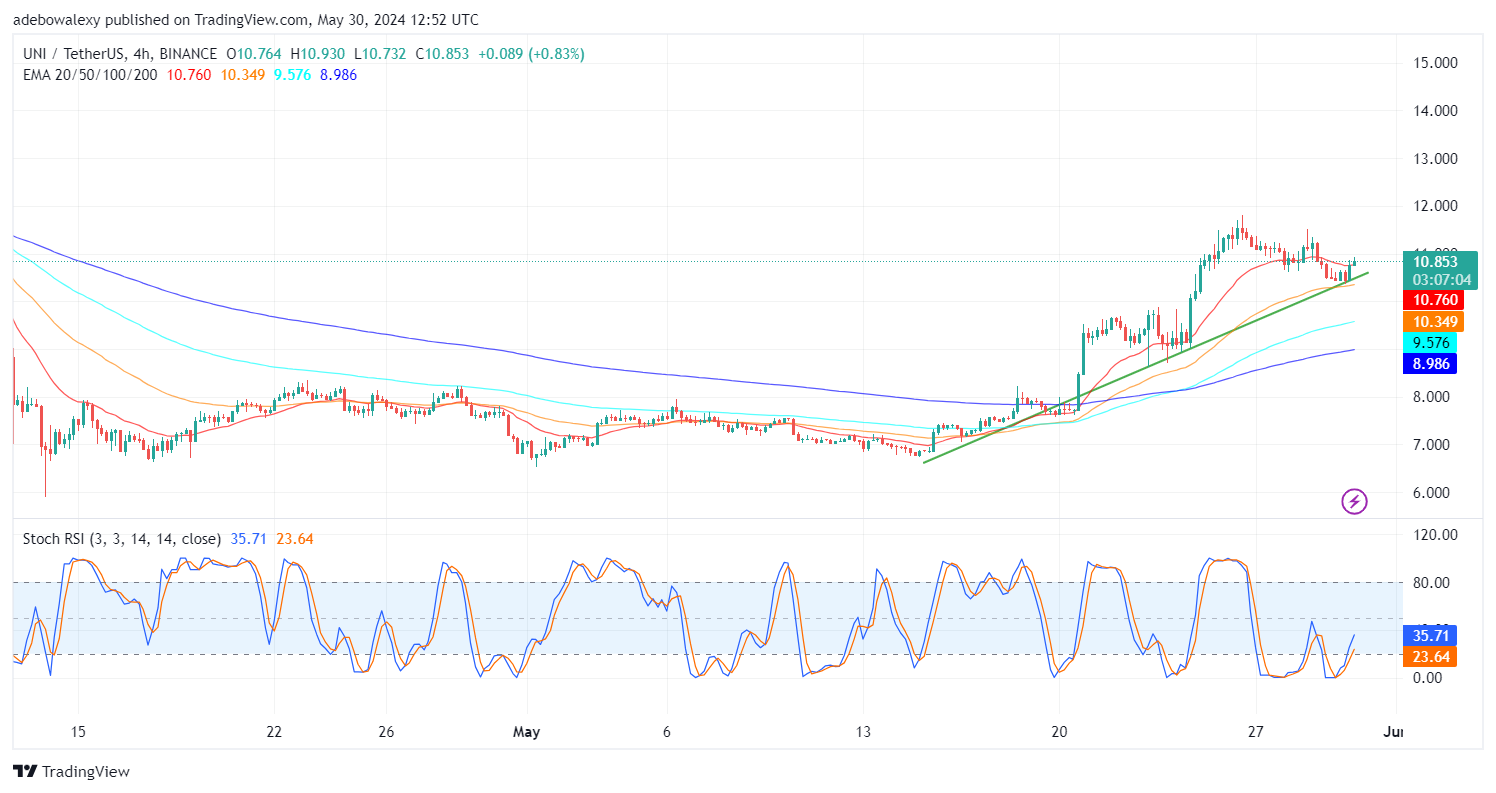
This appears consistent with the price movement on the price chart. Technically, things seem aligned for a continued upside correction through the $11.00 resistance level. Subsequently, price action may then approach the $12.00 price line.