ZKSync (ZK/USDT) Shows Signs of Bullish Breakout Amid Consolidation
Estimated Reading Time: 3 minutes
Don’t invest unless you’re prepared to lose all the money you invest. This is a high-risk investment and you are unlikely to be protected if something goes wrong. Take 2 minutes to learn more

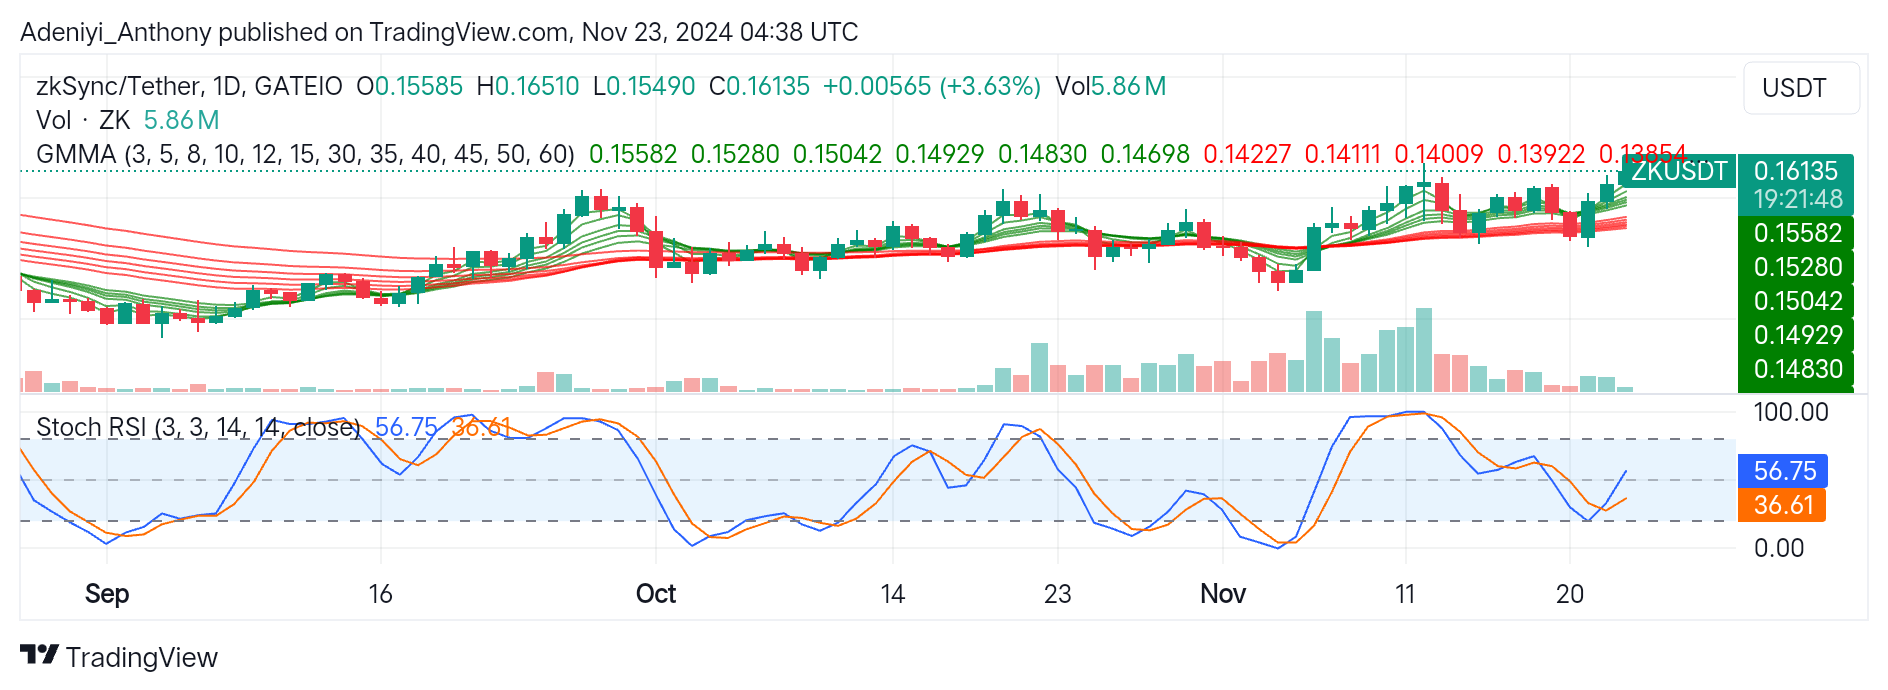
The Zksync (ZK) against the Tether (USDT) is currently showing encouraging signs of bullish momentum towards $0.17000 amid consolidation. Zksync has been trading for a long time within a tight range, with prices fluctuating between the $0.15500 and $0.16500 levels.
The recent price moment suggests a cautious bullish outlook as the pair shows a slight uptick above the Guppy Multiple Moving Averages (GMMA). However, the narrowing of the GMMA suggests the current bullish pressure may be lacking strong conviction as the market awaits a strong trading volume. Therefore, more buying pressure is needed to push the price beyond the $0.17000 level; otherwise, the price may experience a dip if the current momentum wanes.
Currently, Zksync trades at $0.16135 with 5.86 million traded volumes, representing a 3.63% positive above the previous session.
Technical Indicators
Major Resistance Levels: $0.17000, $0.17500, and $0.18000
Major Support Levels: $0.15582, $0.14929, and $0.14830
Zkysnc Technical Analysis
The analysis of Zksync on the daily timeframe suggests the pair is currently experiencing bullish momentum as prices seek to chart a new course after a prolonged consolidation phase.
The GMMA reflects a cautious trade for investors. However, the shorter-term EMAs are above the longer-term EMAs, and the convergence of the two sets of exponential moving averages suggests the market awaits a decisive breakout. To minimize risk, traders need to target the $0.17000 psychological level for a clear break above this level would indicate a clear bullish momentum. Conversely, a price dip below the current price level may suggest a continuation of previous-ranging activities.
On the other hand, the Stochastic RSI suggests the pair has a lot of room for improvement to the north, as both lines of the indicator read 56.75 and 36.61, showing a mild buying interest. To this end, traders need to watch out for an improved condition of the lines; otherwise, a crossover of the lines may suggest a continuation of the consolidation phase.
ZK/USDT Analysis: Expectations
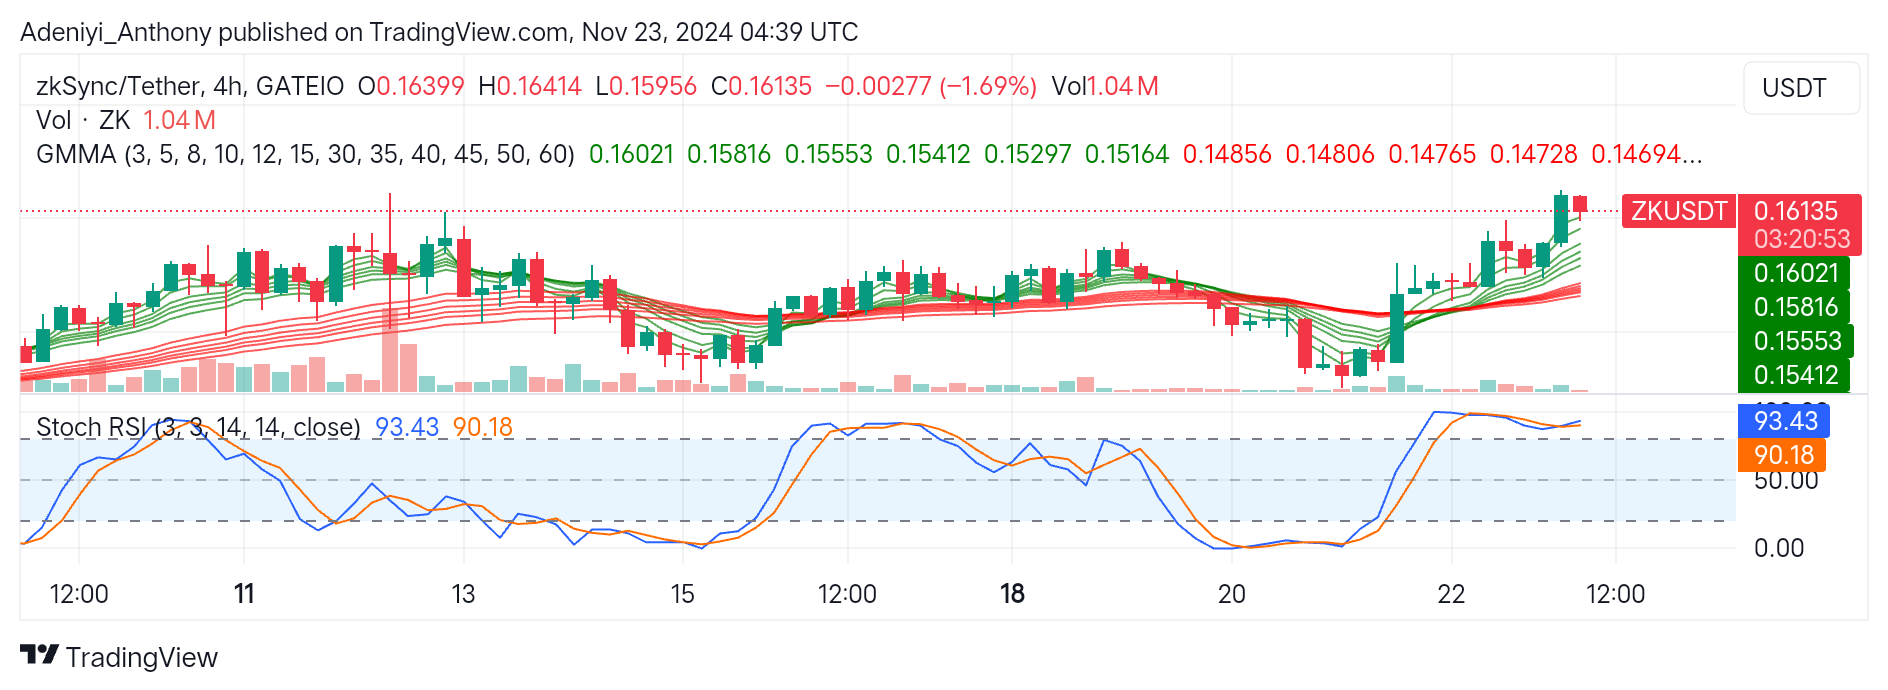
On the daily timeframe, the ZK/USDT is showing a gradual uptrend after a period of sideways movement. The GMMA suggests a continued uptrend, as the positioning and spreading of the two moving averages support this move. However, the positioning of the lines of the Stochastic RSI that read at 94.43 and 90.18 indicates a potential pullback before the continuation of an uptrend as the price looks overextended.
To this end, Traders should keep a close watch on the support and resistance levels. A break above the $0.16500 spike in volume would confirm a bullish trajectory, while a fall below this point would indicate a continuation of ranging activities.
You can purchase crypto coins here. Buy LBlock