BNB (BNB/USDT) Shows Signs of Potential Upside Breakout
Estimated Reading Time: 3 minutes
Don’t invest unless you’re prepared to lose all the money you invest. This is a high-risk investment and you are unlikely to be protected if something goes wrong. Take 2 minutes to learn more
BNB Long-term Analysis: Consolidating
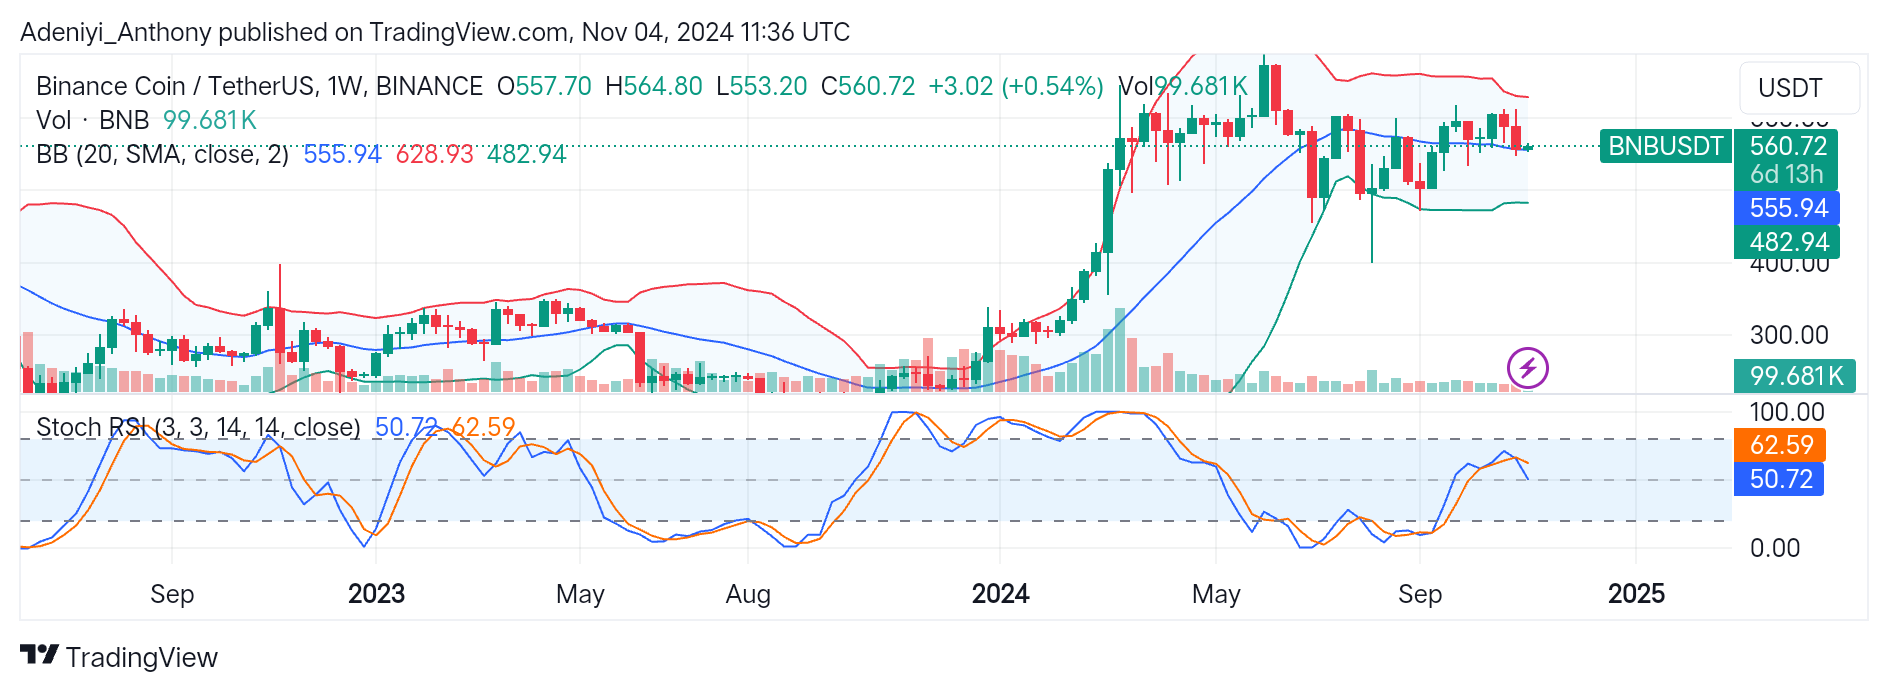
The analysis of BNB against the Tether shows that the pair is beginning to show signs of potential breakout after a prolonged consolidation phase. BNB experienced a strong uptrend at the beginning of the year. However, the pair seems to have met stronger bearish pressure at the peak around the $700 level before retracing to range between the $500 and $600 levels.
The recent price movement above the middle band suggests the price may be gathering momentum towards the $628.93 level. However, the volume and the placement of the Stochastic RSI indicate that the current bullish uptick may not have a strong conviction.
To this end, the price will advance past the upper band if the buying pressure persists. Otherwise, a break below the $555.94 level may result in a downtrend.
Currently, the pair trades at $560.72, with a 0.54% positive difference in the session.
Technical Indicator
Major Resistance Levels: $570, $628.93, and $650
Major Support Levels: $555.94, $482.94, and $450
BNB Technical Analysis
The BNB on the weekly chart has been oscillating between key levels with relatively low volume reflecting a lack of decision from the traders. However, the Bollinger bands on the chart suggest there might be a breakout to either soon. Therefore, the $628.93 level is achievable if more bullish traders enter the market.
On the other hand, the Stochastic RSI suggests the pair is in a neutral zone and a breakout to either side is possible provided one of the conditions above is met with an increasing volume.
BNB/USDT Analysis: A Breakout to Which side?
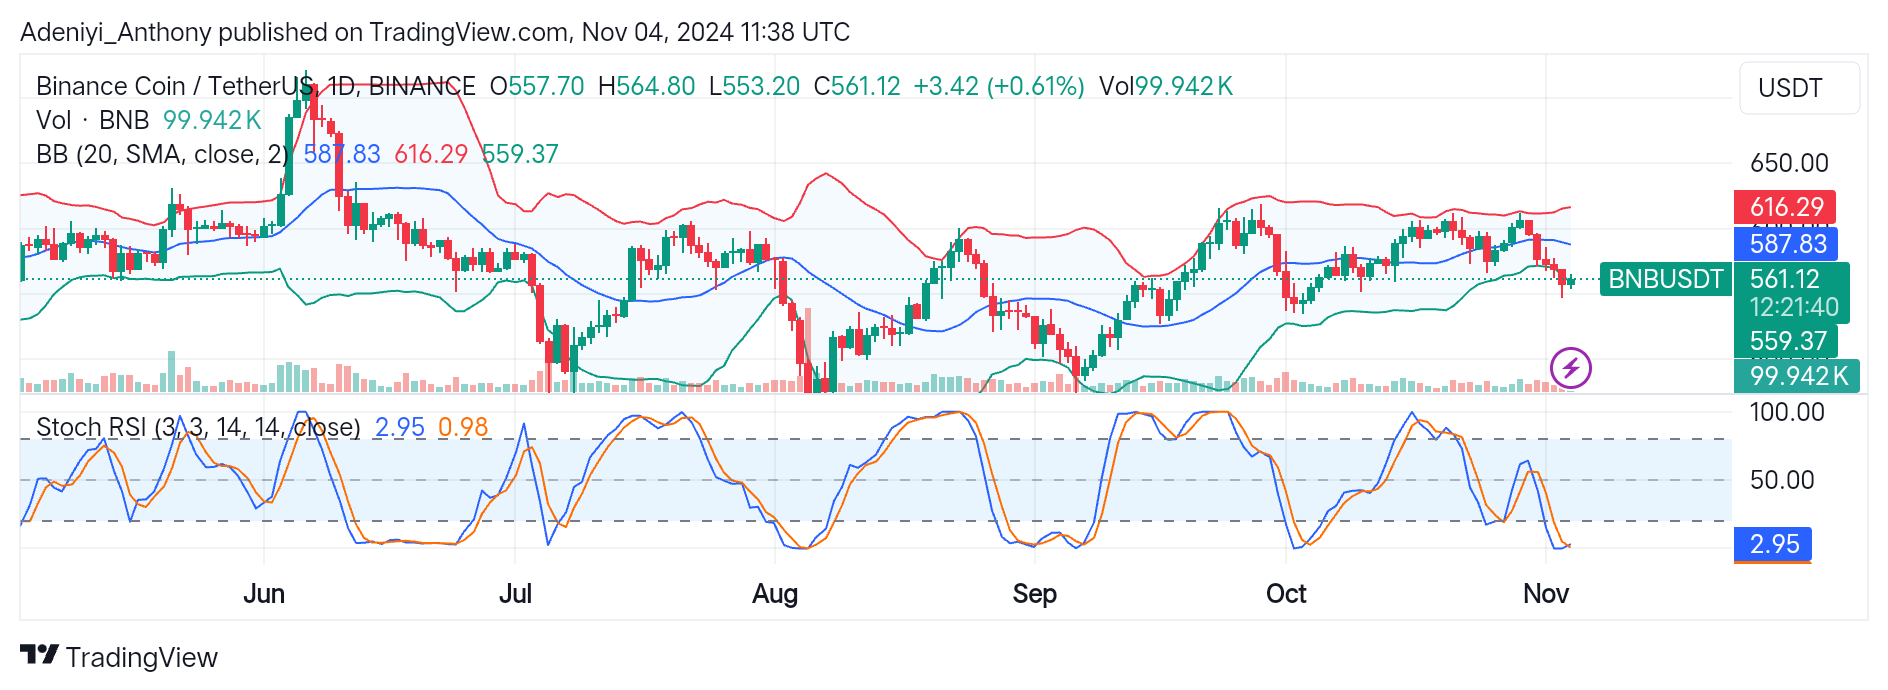
On the daily timeframe, BNB/USDT seems to be moving in a wave-like pattern in an upward direction. However, after a recent low, the current price action around the lower band suggests the pair is operating in the oversold region and may be due for a reversal provided it holds above the $559.37 level.
Moreover, the Stochastic oscillator at the downside of the chart also indicates an oversold condition and a reversal could be expected. Traders must watch for a stochastic crossover as the price seeks to break above the middle band at $587.12.
You can purchase crypto coins here. Buy LBlock