ZKSync (ZK/USDT) Tests Key Resistance Levels Amid Bullish Momentum
Estimated Reading Time: 3 minutes
Don’t invest unless you’re prepared to lose all the money you invest. This is a high-risk investment and you are unlikely to be protected if something goes wrong. Take 2 minutes to learn more

Zksync against the Tether has seen an uptick in volatility recently alongside other altcoins by exhibiting strong bullish momentum.
Over the last few days, ZK/USDT has shown signs of bullish strength, pushing closer to a significant resistance levels with heightened trading volume. This rally aligns with an overall positive market sentiment and growing interest in layer-2 scaling solutions.
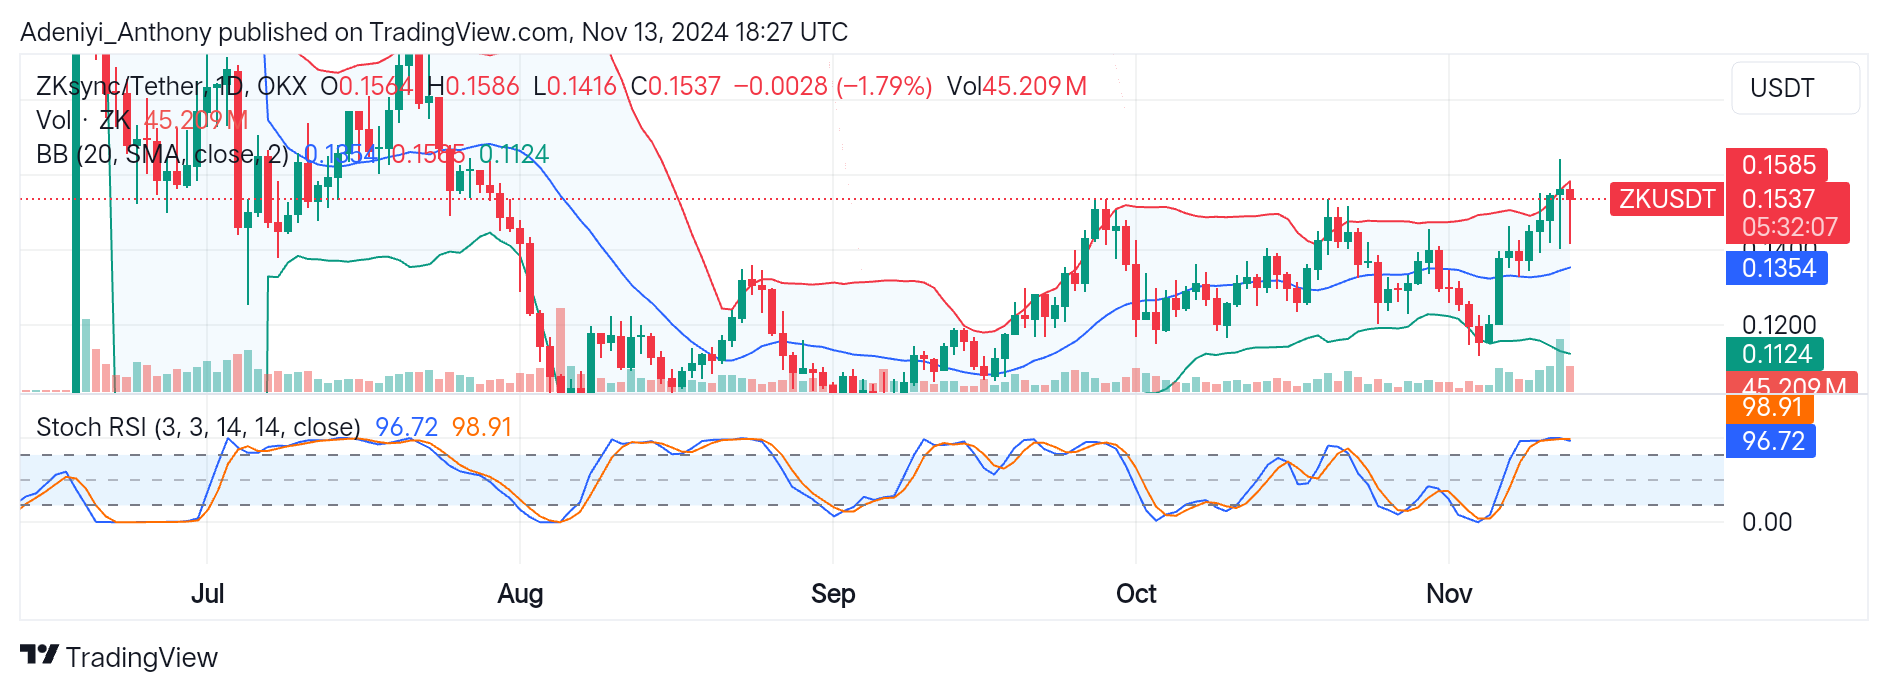
However, despite the optimism, the pair faces challenges in breaking through the resistance at $0.1585 which could decide the continuation or reversal of the current trend.
Currently ZK/USDT trades at $0.1537 with over 45 million traded volumes.
Technical Indicator
Major Resistance Levels: $0.1585, $0.1700, and $0.1850
Major Support Levels: $0.1354, $0.1200, and $0.1124
ZKSync Technical Analysis
The technical analysis of Zksync against the Tether on a daily timeframe is showing a mixed signal, with recent bullish momentum being challenged by an overbought condition. The positioning of the pair at the upper Bollinger band suggest the ZK is operating at a critical level. While indicators used in the analysis may suggest strong bullish momentum, the slight rejection at $0.1585 and the overbought condition of the Stochastic RSI caution against excessive optimism.
To this end, a clear break above the $0.1585 level could set ZK/USDT on a continued bullish trajectory towards $0.1700 and beyond. However, a retrace towards the immediate support at $0.1354 might set in if the bullish traders fails to maintain the current momentum.
Traders needs to watch these levels closely to gauge the strength of the ongoing trend, as the lines of the oscillator suggest there might be a short-term pullback.
ZK/USDT Analysis: What is the Next Move?
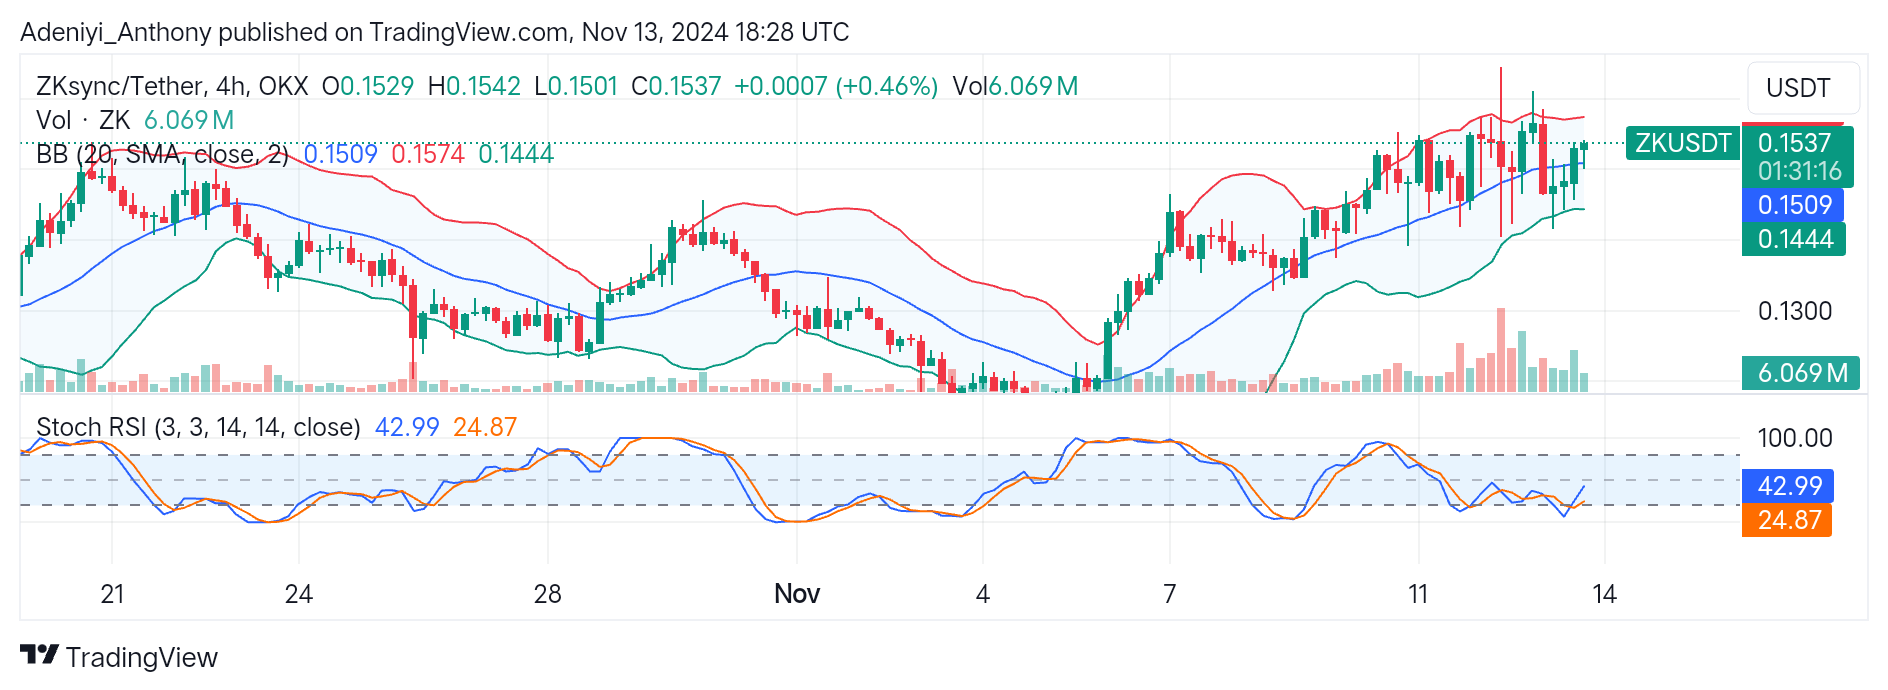
On the 4H timeframe, ZK/USDT has shown signs of consolidation after a period of heightened volatility. However, as market sentiment remains optimistic for this period, ZKsync lacks direction with the price testing immediate supports at $0.1509.
The current setup suggests a market void of volatility which precede a significant move. A bullish breakout could be initiated if price breaks above the upper band at $0.1574. conversely, a move towards the lower band could indicate further downside movement.
At the bottom of the chart, the Stochastic oscillator reads between the 20 and 40 levels, indicating a neutral condition. However, the lines of the indicator seem crawling, and a bounce to the North may occur if bullish pressure increases. Contrarily, the moderate volume as seen in the flat lines implies a wait-and-see approach, possibly awaiting a clear breakout or breakdown from the current consolidation phase.
You can purchase crypto coins here. Buy LBlock