Avalanche (AVAX/USD) Bullish Intervention Playing Out Around the $35 Price Level
Estimated Reading Time: 3 minutes
Don’t invest unless you’re prepared to lose all the money you invest. This is a high-risk investment and you are unlikely to be protected if something goes wrong. Take 2 minutes to learn more
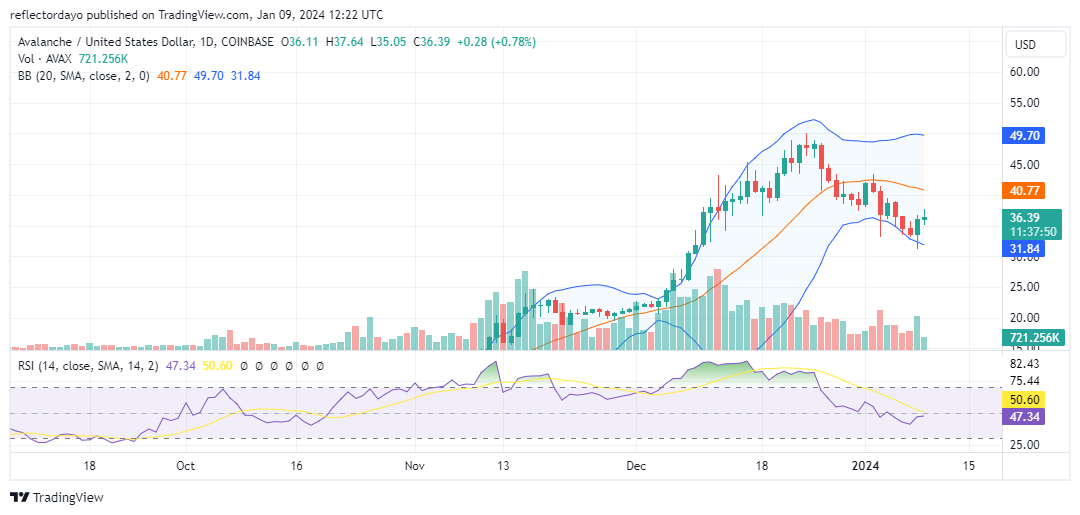
The Avalanche (AVAX) price reached its pinnacle at the $50 mark on Christmas Eve of the previous year. Subsequently, a bearish trend was initiated, persisting into the early part of this year. Recently, however, buyer interest has revived, with purchases resuming around the $35 price level. The bullish momentum was notably initiated near the $31 mark during the preceding daily session. While the Avalanche bull market has extended into today’s trading session, there is a growing resurgence of bearish sentiment. As such, a potential showdown between bullish and bearish forces is anticipated around the $36 price level.
Avalanche Market Data
- AVAX/USD Price Now: $36.41
- AVAX/USD Market Cap: $13,349,278,199
- AVAX/USD Circulating Supply: 366,602,206 AVAX
- AVAX/USD Total Supply: 434,635,166 AVAX
- AVAX/USD CoinMarketCap Ranking: #9
Key Levels
- Resistance: $40, $45, and $50.
- Support: $30, $25, and $20.
The Avalanche Market Forecast: Analyzing the Indicators
As bullish momentum attempts to elevate the price, it contends with a significant level of bearish sentiment prevailing in the market. This has rendered the market relatively stagnant around the current price level. Upon examining today’s trading activities through the lens of the candlestick charts, one can observe today’s candlestick having a small body accompanied by pronounced upper and lower shadows. Such a pattern suggests active participation from both bulls and bears, reflecting heightened investor interest. Nevertheless, this impasse between supply and demand may lead to a consolidation phase, potentially around the $36 price threshold. This price range could persist until the market exhibits a decisive move in either a bullish or bearish direction.
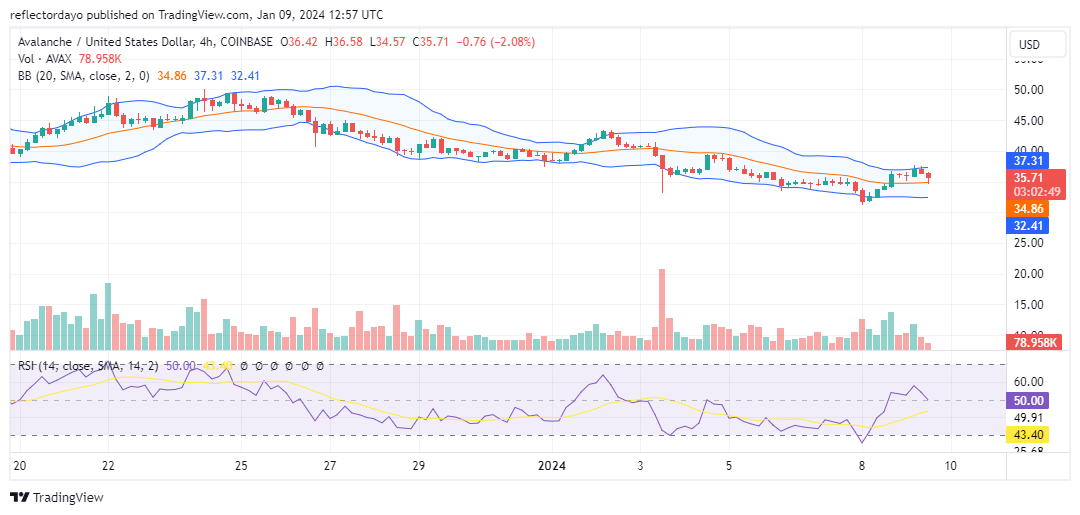
AVAX/USD 4-Hour Chart Outlook
Upon closer examination of the Avalanche market within a shorter time frame, there appears to be a slight downward trend. However, as the price action approached the $32 level, the subtle bearish momentum appeared to halt. The Bollinger Bands indicator now suggests a predominantly horizontal price channel, with the price action positioned above the 20-day moving average. This positioning potentially places the bulls in a favorable position to assert dominance in the market.