Origin Protocol (OGN/USD) Tackles Resistance at $0.180
Estimated Reading Time: 3 minutes
Don’t invest unless you’re prepared to lose all the money you invest. This is a high-risk investment and you are unlikely to be protected if something goes wrong. Take 2 minutes to learn more
The bullish momentum in the Origin Protocol market commenced in early September 2023. Initially, the market displayed aggressive growth, surging from the pivotal support level of $0.07 to an impressive $0.20 by September 30. This rapid increase prompted significant profit-taking, culminating around the $0.10 support level by October 20. Following this correction, bulls showed renewed interest, leading to a more nuanced and gradual upward movement.
Origin Protocol Market Data
- OGN/USD Price Now: $0.17
- OGN/USD Market Cap: $97,347,447
- OGN/USD Circulating Supply: 571,560,847 OGN
- OGN/USD Total Supply: 1,000,000,000 OGN
- OGN/USD CoinMarketCap Ranking: #375
Key Levels
- Resistance: $0.52, $0.55, and $0.60.
- Support: $0.42, $0.40, and $0.35.
The Origin Protocol Market Forecast: Analyzing the Indicators
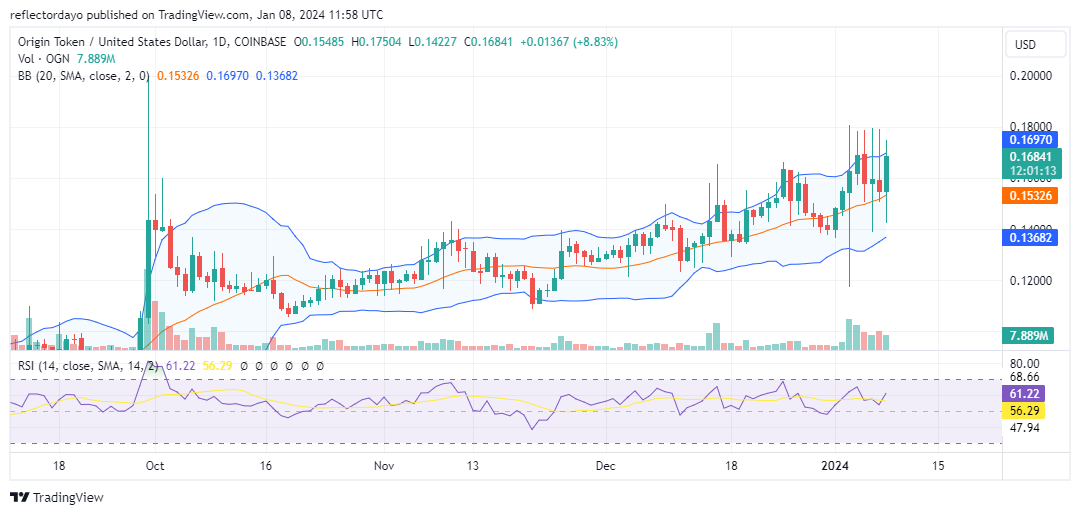
As the new year approaches, the Origin Protocol market has witnessed increased bullish sentiment, driving the price into higher valuation zones and consequently elevating market volatility. A significant resistance is evident near the $0.1800 price level. However, the establishment of a new support level at $0.155 intensifies pressure on this resistance, potentially paving the way for a breakthrough.
Technical indicators are favorable. The Bollinger Bands indicate price action above the 20-day moving average, and the Relative Strength Index (RSI) registers market momentum around the 61 level, suggesting a bullish dominance. Despite consistent rejections by the bearish defense line at the $0.1800 level since January 3, the presence of support at $0.155 implies sustained pressure on the bearish barriers.
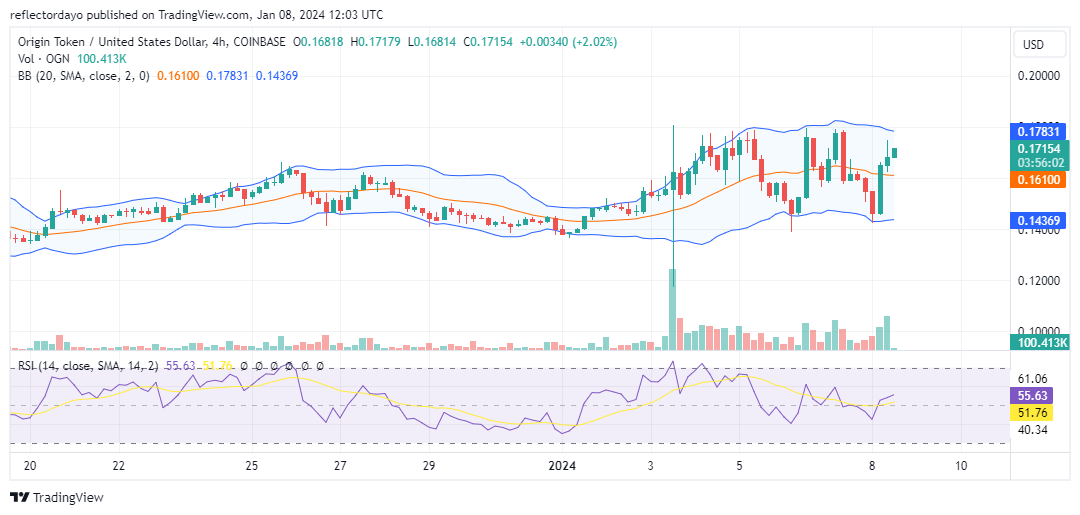
OGN/USD 4-Hour Chart Outlook
Based on the 4-hour chart analysis, the market appears to be trading sideways despite the current high volatility. There is a prevailing optimism among traders that the price will soon surpass the $0.1800 resistance level. The indicators support this positive outlook. However, a recent price retracement, characterized by a pronounced upper shadow on the preceding candlestick of the last trading session, has led to a notable response in the upper standard deviation of the Bollinger Bands due to the downward price movement. Nevertheless, as long as the bulls maintain their position above the 20-day moving average, they remain in a favorable position.