EigenLayer (EIGEN/USDT) Shows Signs of Potential Upside Recovery
Estimated Reading Time: 3 minutes
Don’t invest unless you’re prepared to lose all the money you invest. This is a high-risk investment and you are unlikely to be protected if something goes wrong. Take 2 minutes to learn more

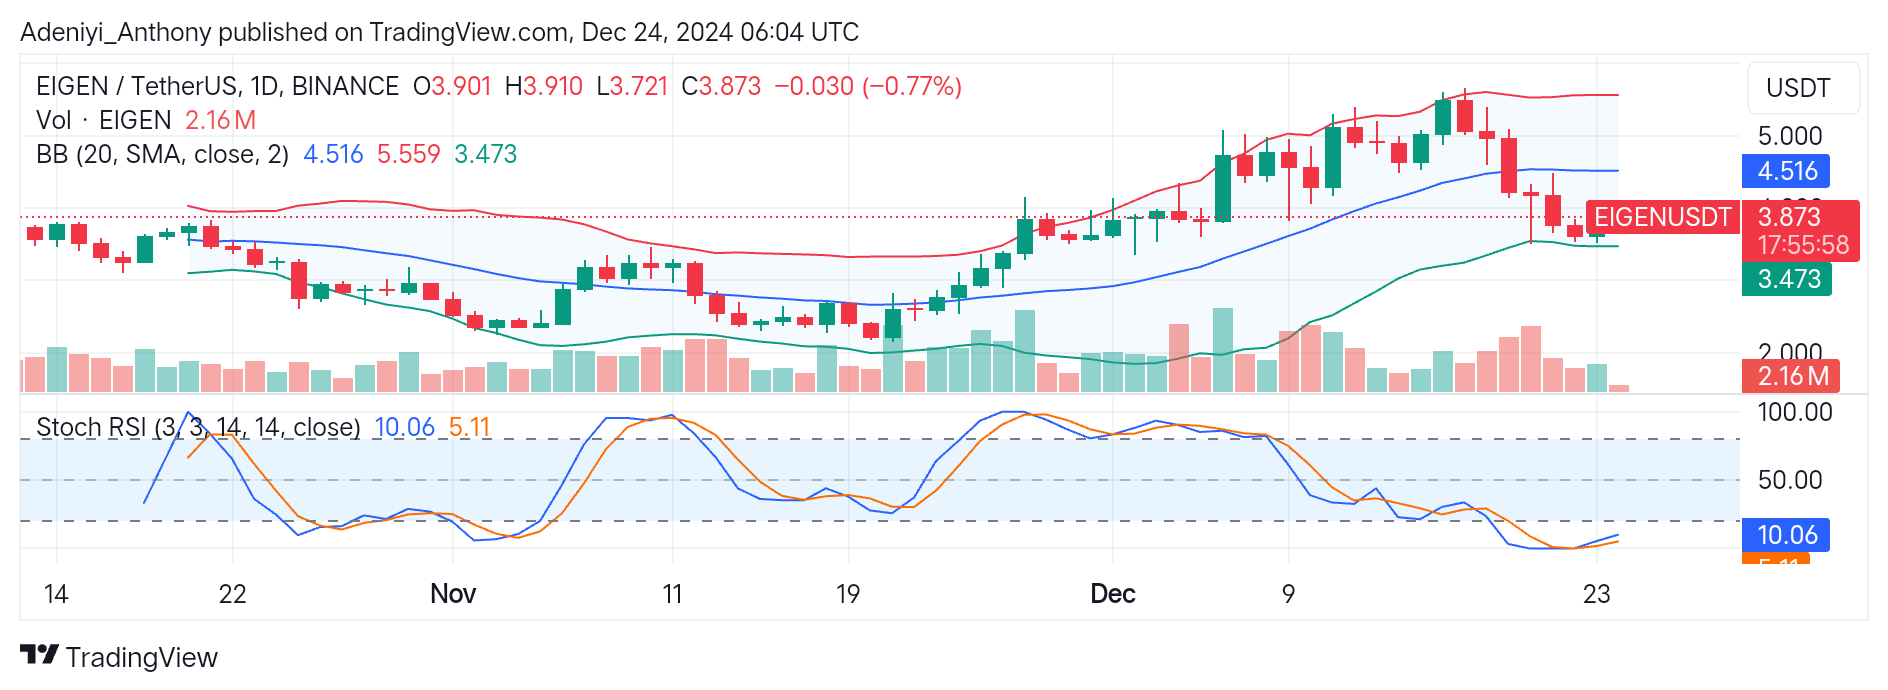
Eigenlayer against the Tether for days has been on the decline since the price hit the $5.000 level, breaking the middle Bollinger band at the $4.000 level for the lower band. The consistent fall in price indicates the heavy presence of bearish traders in the market.
However, recent price action around the lower band and the positioning of the indicators suggest that the Eigenlayer against the USDT might bounce to the North soon, as the lines of the oscillator below show signs of improvement.
Currently, EIGEN/USDT trades at $3.873, a position that is 0.77 lower than the previous session.
Technical Indicators
Major Resistance Levels: $4.516, $4.700, and $5.000
Major Support Levels: $3.473, $3.200, and $2.900
Eigenlayer Technical Analysis
The analysis of EigenLayer on a daily timeframe shows that EigenLayer against the Tether has been on a downtrend since the beginning of this month after hitting a new high. However, the price seems too close to the lower band at $3.473, signaling an oversold condition. In the short term, this level may act as a springboard towards the $4.000 level, provided there is a spike in the trading volume.
Additionally, the Stochastic RSI suggests the pair operates in the oversold region, with the lines reading extreme values. However, the recent behavior and crossover of the lines indicate that EIGEN/USDT might be positioned for a price recovery in the near term; otherwise, a decline toward $3.20 is imminent if the price fails to hold at the current level.
EIGEN/USDT Analysis: Expectations
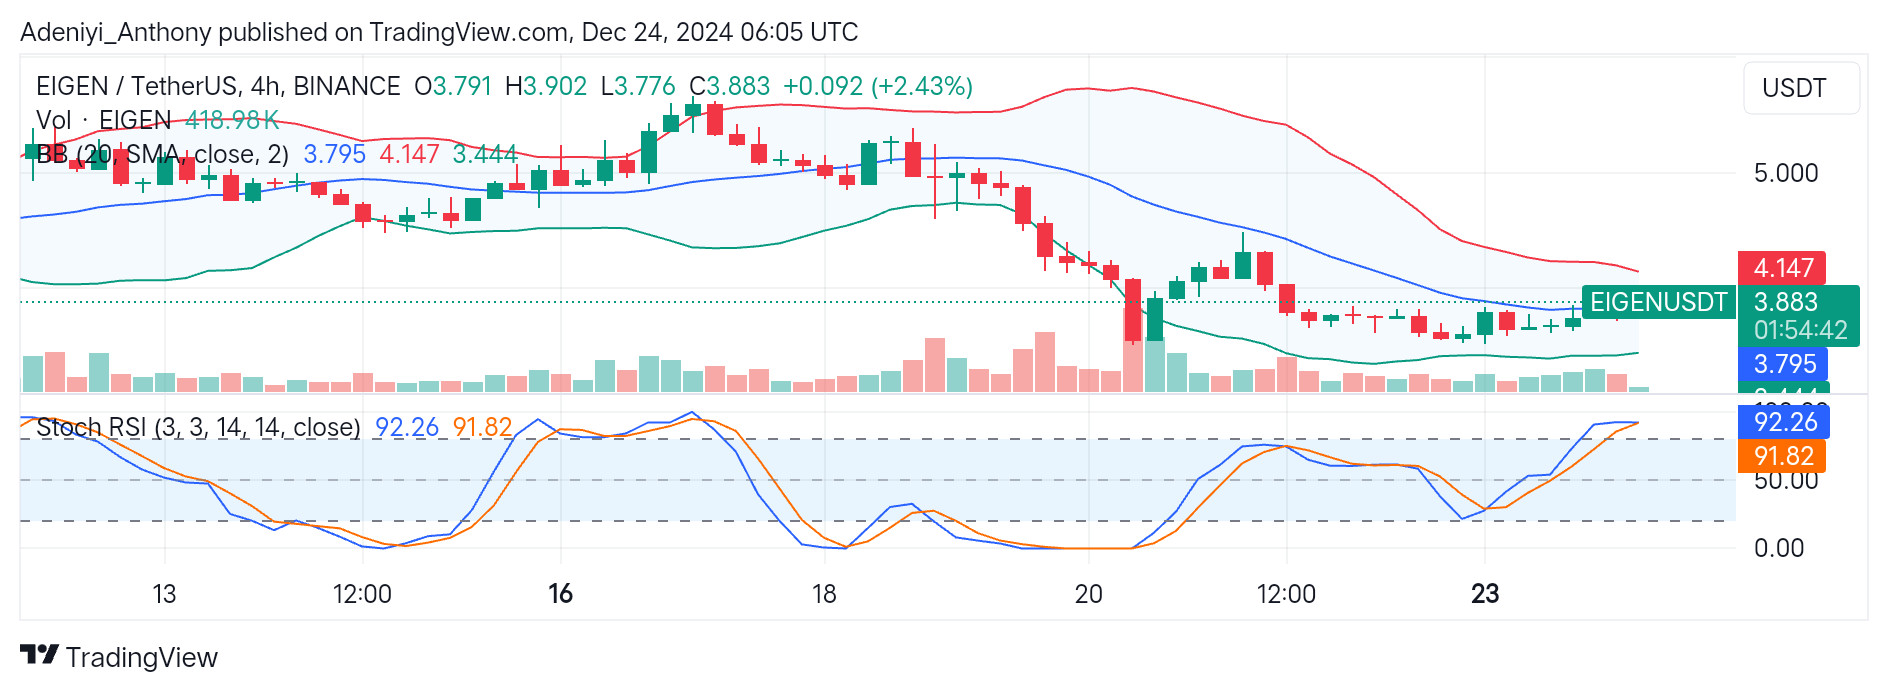
On the 4-hour chart, EIGEN/USDT shows a slight recovery as the price moves up by 2.43%, indicating an attempt to stabilize after the recent prolonged selling pressure.
However, while the current recovery to the upper band at $4.147 looks promising, the Stochastic oscillator at the bottom of the chart suggests caution, as the pair is positioned in the overbought region.
Traders might want to wait for confirmation as the price stabilizes above the middle Bollinger band before placing a trade.
To this end, a persistent increase in the buying strength would push the price beyond the $4.147 for the $4.300 level; otherwise, the price may dip below $3.444 at the lower Bollinger band.
You can purchase crypto coins here. Buy LBlock