EigenLayer (EIGEN/USDT) Signals Further Downtrend Amid Market Volatility
Estimated Reading Time: 3 minutes
Don’t invest unless you’re prepared to lose all the money you invest. This is a high-risk investment and you are unlikely to be protected if something goes wrong. Take 2 minutes to learn more

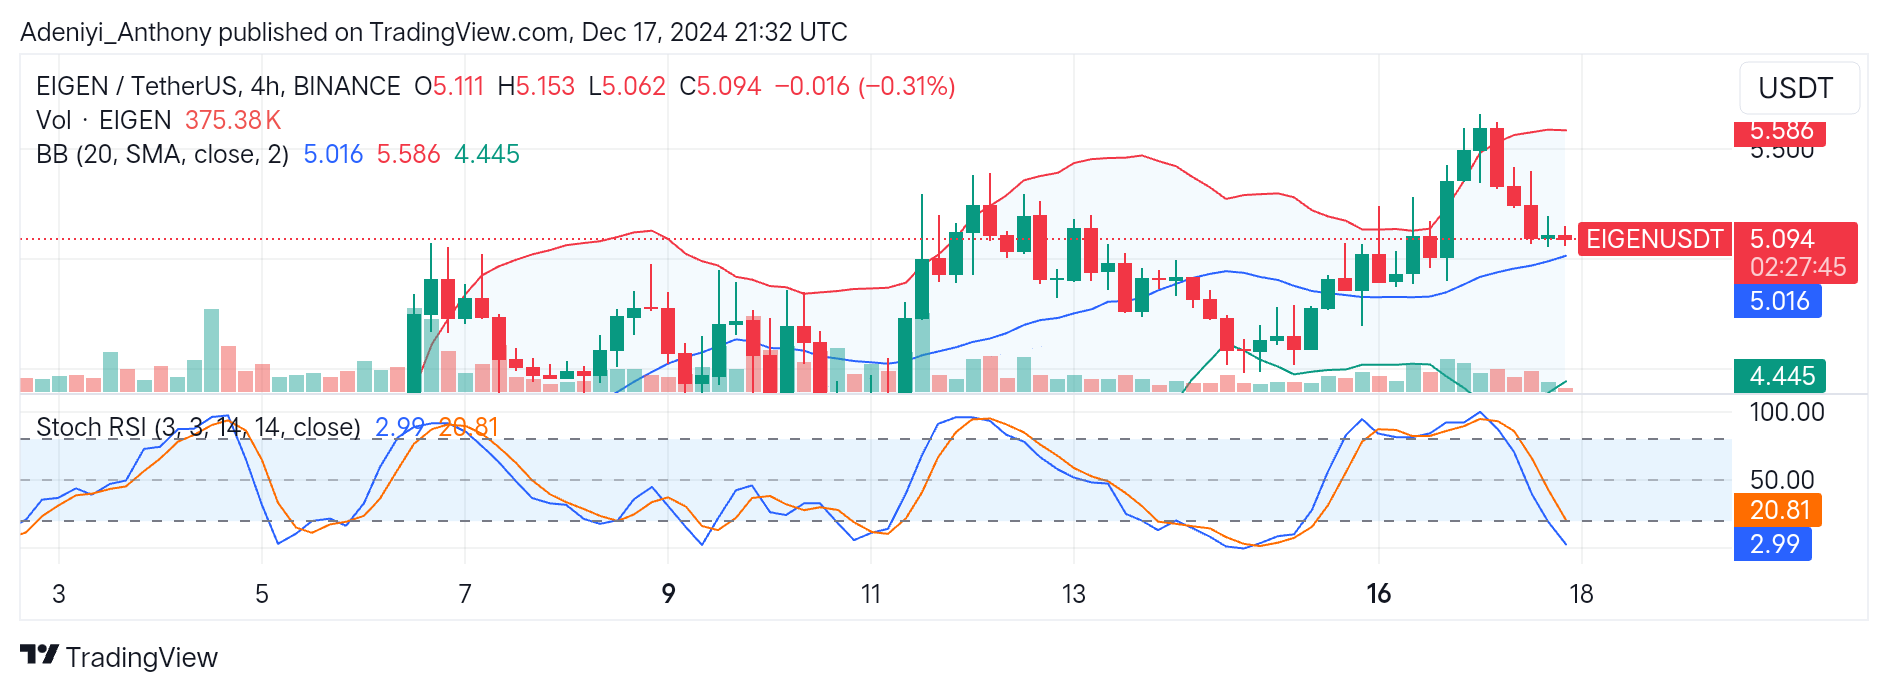
The general market sentiment of Eigenlayer against the Tether suggests a cautious market. It reflects a situation where the bulls are taking profit while the bears keep pushing the price towards a critical support level. This can be seen in the sharp decline in price from $5.586 at the upper band.
EIGEN against the USDT on a 4-hour timeframe is showing signs of further price dip with recent price movement reflecting a minor pullback towards the mid-band. However, the Bollinger Bands seem to be tightening, suggesting reducing volatility as the price struggles below key resistance near $5.100. Likewise, the Stochastic RSI aligns with signals of an oversold condition with more downside room in the near term.
Therefore, if the selling pressure towards the critical support levels continues, EIGEN may face further corrections before bulls attempt a recovery.
Currently, Eigenlayer is trading at $5.094 with a moderate 373.38 thousand.
Technical Indicators
Major Resistance Levels: $5.100, $5.300, and $5.586
Major Support Levels: $5.016, $4.450, and $4.200
EigenLayer Technical Analysis
The analysis of Eigenlayer shows that its price has recently dropped towards the mid-band at $5.016, signaling a bearish bias as the gaps between the bands reduce. However, a continuation of the trend below $4.450 seems likely if selling momentum is maintained. Conversely, a break above $5.016 would invalidate the bearish move.
On the other hand, the Stochastic RSI is declining sharply as the lines of the indicator head into the extreme oversold position. This indicates a strong bearish momentum and a continuation of the current trend. Therefore, the lines of the Stochastic reading at 2.99 for blue and 20.81 for orange need to cross over for a reversal to occur.
EIGEN/USDT Analysis: Recovery or Further Downtrend
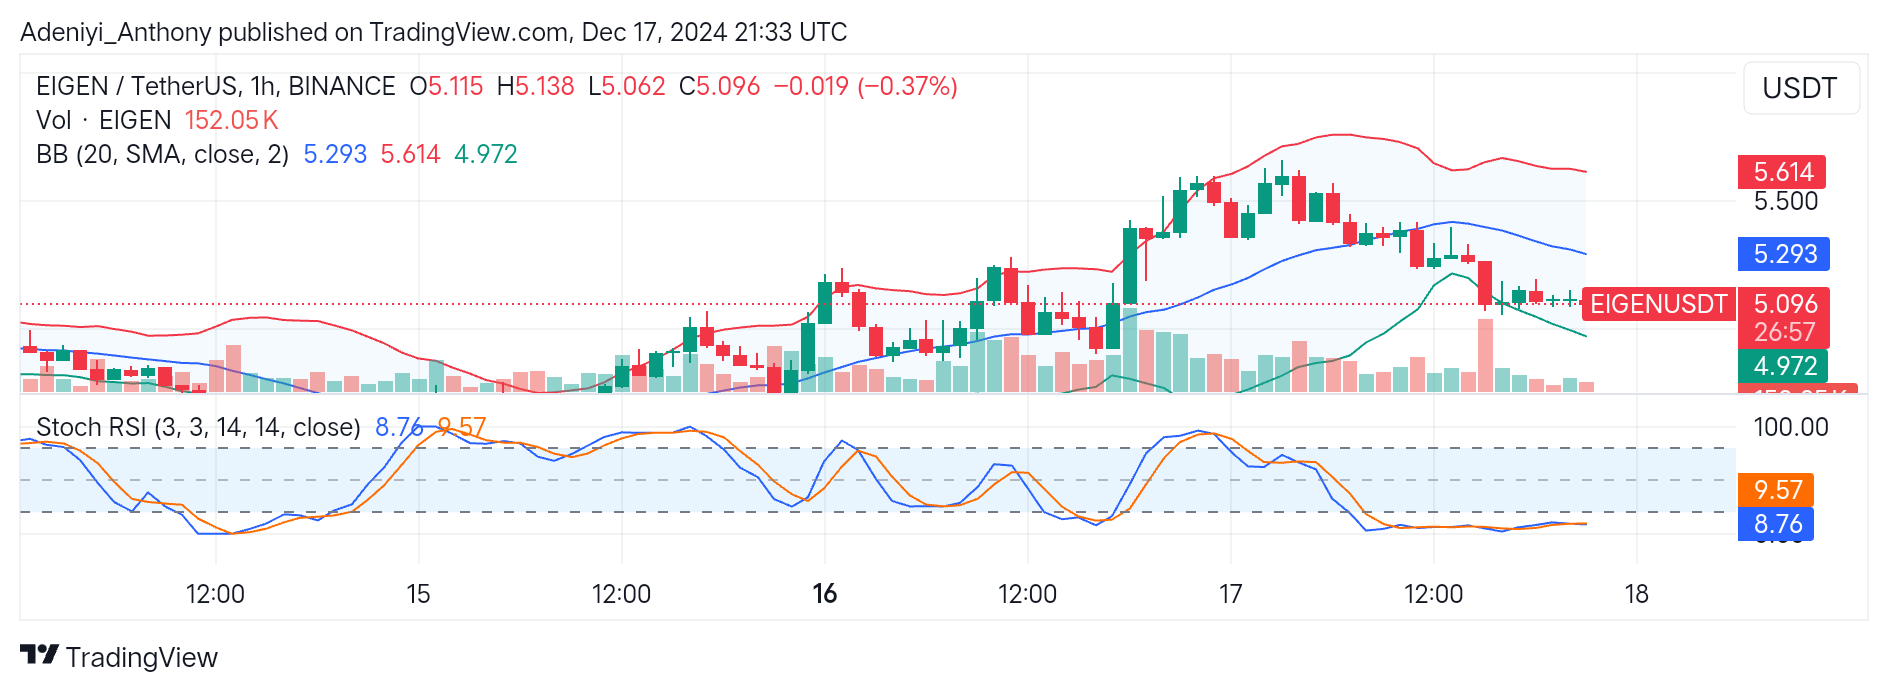
In the 1-hour timeframe, EIGEN/USDT consolidates around $5.096 with clear bearish tendencies as the price struggles to recover from recent highs.
The Bollinger bands signal increased selling pressure with the price hovering next to the lower band at $4.972.
Additionally, the Stochastic oscillator shows an oversold condition, with the lines’ behavior showing a lack of bullish crossover. To this end, if the price fails at $5.100, a retest of the recent support level is possible.
Though the short-term sentiment leans bearish, with considerable low volume and sellers maintaining position, the bulls must reclaim key levels to counter the prevailing downtrend.
You can purchase crypto coins here. Buy Block