Litecoin (LTC/USD) Price Is Above $65, Aiming for Surging Motions
Estimated Reading Time: 3 minutes
Don’t invest unless you’re prepared to lose all the money you invest. This is a high-risk investment and you are unlikely to be protected if something goes wrong. Take 2 minutes to learn more
Litecoin Price Prediction – January 16
A line of $60 has been the deadlier lower support spot in the market operations of Litecoin versus the valuation of the US coin, given that the crypto-economic price stays above the point of $65, aiming for syrging motions.
It is likely that the price of the cryptocurrency trade is still going to succumb to some leftover depressing motions to get replaced toward the point of $65. As of the time of this psychological piece, signs of rising force have been in the making to signify that bulls are making efforts to push back upward, possibly through resistances above the middle Bollinger Band.
LTC/USD Market
Key Levels:
Resistance levels: $80, $85, $90
Support levels:$65, $60, $55
LTC/USD – Daily Chart
The LTC/USD daily chart reveals that the crypto-economic trade stays above the point of $65, aiming for surging motions.
The Bollinger Band indicators have been placed easterly systemically to depict ideal points against the buy point at the upper line and the lower part. The stochastic oscillators are in a mode of crossing slightly southbound, placing around 60 and 40 points.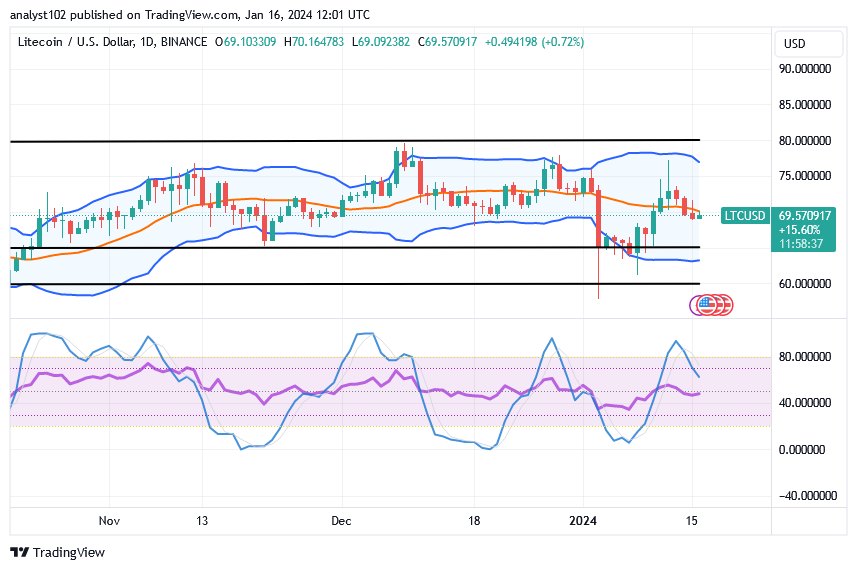
Is it technically the right time for long-position placers to begin recovering, considering that the current price of the LTC/USD market is approximately $69?
Long-term long-position placers may start the process of launching longing position orders, given that the LTC/USD market stays above the point of $65, aiming for surging motions.
Even though a smaller candlestick is beginning to show that buyers are trying to rally at this time, there is still a chance that a force will develop to trigger a series of negative moves with the intention of testing the $65, or trade zone. If that’s the case, repurchasing aptitudes should fall into place very easily.
It might be a means of inciting a jerky trading session should the price drop from its present negotiation level of roughly $69 or so. The upper Bollinger Band trend line at the topside, which represents the trade barrier line of approximately $75, is still relevant in indicating the range of transactions in which sellers might rekindle their hopes of receiving orders for shorting positions. 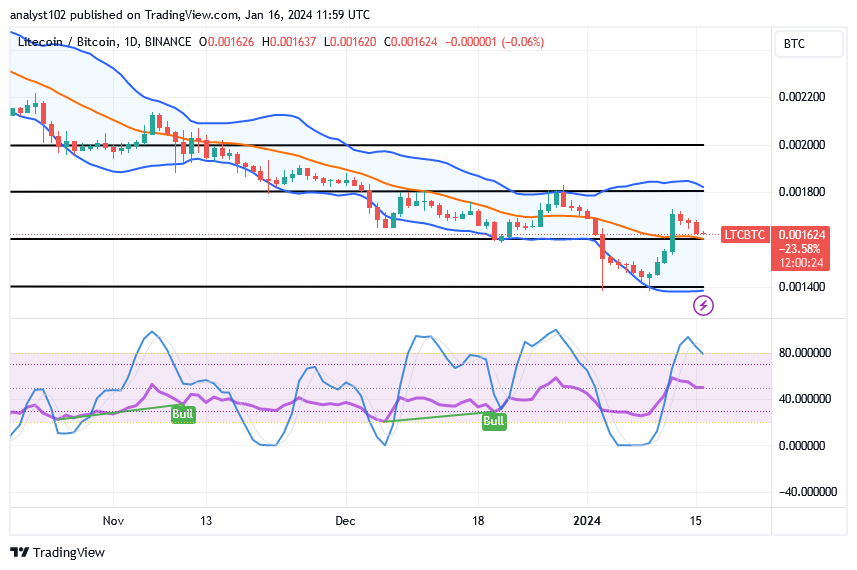
LTC/BTC Price Analysis
In contrast, Litecoin’s transaction line versus the valuation of Bitcoin currently stays around the middle Bollinger Band, aiming for surging motions.
Since the Bollinger Bands are positioned more bearishly and a new baseline is being created at the lower end of the indicators, the situation with the rising motions has not been very realistic in the near term. The stochastic oscillators have crossed to the south for a brief period of time, indicating that the base instrument may eventually yield another cycle of minor corrections before rallying pressure picks up again.
Note: Cryptosignals.org is not a financial advisor. Do your research before investing your funds in any financial asset or presented product or event. We are not responsible for your investing results.
You can purchase Lucky Block here. Buy LBLOCK