Litecoin (LTC/USD) Trade Suffers a Decline, Rebuilding a Base
Estimated Reading Time: 4 minutes
Don’t invest unless you’re prepared to lose all the money you invest. This is a high-risk investment and you are unlikely to be protected if something goes wrong. Take 2 minutes to learn more
Litecoin Price Prediction – January 9
The enabling environment situation has come the way of bears as a result of the inability of bulls to capitalize on their recovery moving motion through some higher resistances recently, as the Litecoin market suffers a decline against the worth of the US coin, rebuilding the energy at a base marked at $60.
A brief period of transactions around the $60 line has shown false fast-swerving forces, indicating that there are indications that future drop lines won’t be able to hold firmer through the value line’s underlying supports mentioned earlier over time. Investors are urged to begin introducing their funds as soon as such a rebound manifests
LTC/USD Market
Key Levels:
Resistance levels: $75, $80, $85
Support levels:$60, $55, $50
LTC/USD – Daily Chart
The LTC/USD daily chart reveals that the crypto-economic market suffers a decline, rebuilding a base around the trending zone of the lower Bollinger Band.
The last seven days have seen the appearance of a big bearish candlestick, which indicates the last touch of the lower level that bears might reasonably push before turning $60 into the real important line against the present trading range of $65.16 or so. The procedures to follow will heavily rely on the lower Bollinger Band. The stochastic oscillators are consolidating as they move in the oversold area.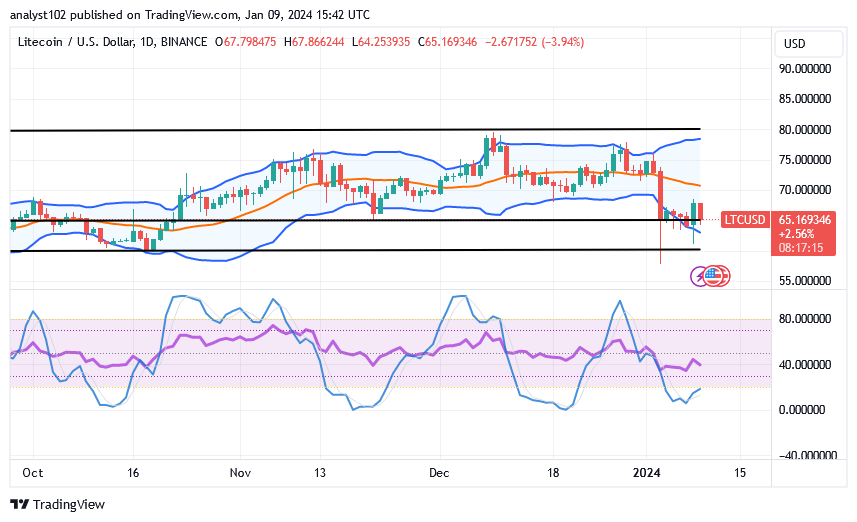
When the price of LTC/USD trades near $65, might there be additional declines at the lower edge of the Bollinger Band?
Even though a downward reversal motion is in the making as of this technical piece, we recommend that long-term position takers stick to their way of staking positions rather than resort to making a sales-off, given that the LTC/USD market suffers a decline, rebuilding a base.
There are already signs pointing to the possibility that a series of swing lows that trigger the moment of stretching southerly will result in additional rounds of buying dip processes on a systemic level. Should the market fail to persistently move above the middle Bollinger Band trend point, price movements will remain trapped between $70 and $60 for some time before rising once more to the moon side.
Technically speaking, as the Bollinger Band trend line is positioned to provide a critical note on the market line, sellers should hang onto their retarding actions in the event that they see bulls attempting to take it northward over the $70 mark. Selling objectives may now be put on hold for a bit.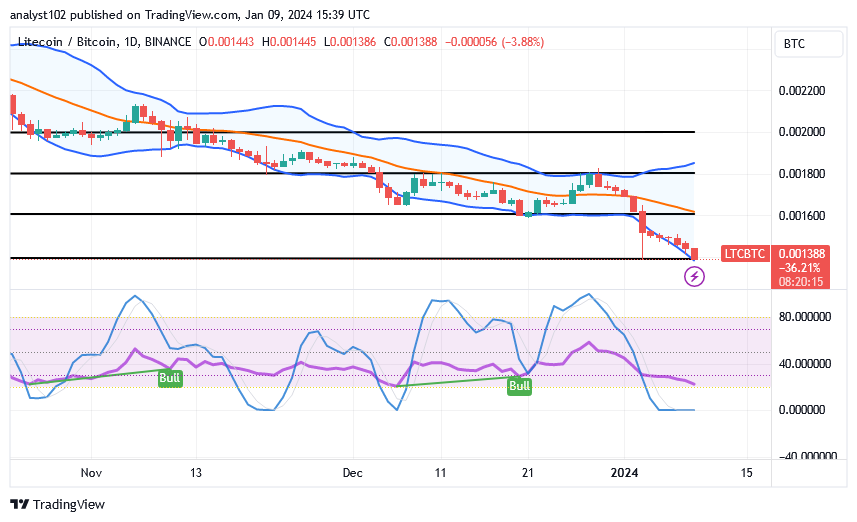
LTC/BTC Price Analysis
In contrast, the Litecoin market operation currently suffers a decline versus the trade worth of Bitcoin, rebuilding a base in the lower zones.
Notably, no bullish candlestick has shown to indicate that the downward trending force has reached its lower end trading zone. Therefore, relieving the pressure that the countermeasure has been applying has to be dealt with with caution. For us to have a trustworthy entry for placing a buy order, a candlestick must turn around the lower Bollinger Band. The stochastic oscillators show that a selling velocity is in place because they are moving in a consolidation pattern and are in the oversold area.
Note: Cryptosignals.org is not a financial advisor. Do your research before investing your funds in any financial asset or presented product or event. We are not responsible for your investing results.
You can purchase Lucky Block here. Buy LBLOCK