Litecoin (LTC/USD) Trade Pushes Lowly, Pushing for a Recovery
Estimated Reading Time: 3 minutes
Don’t invest unless you’re prepared to lose all the money you invest. This is a high-risk investment and you are unlikely to be protected if something goes wrong. Take 2 minutes to learn more
Litecoin Price Prediction – December 26
There has been a successful strong underlying support built around the lower Bollinger Band positioning around $70, as the LTC/USD trade pushes lowly, pushing for a recovery.
A rising indicator has been created in a slowing way to indicate that buyers should proceed with the utmost caution when making a comeback. The lower Bollinger Band trend line has stayed in a steady position, just below the $70 value line. The stronger underlying support line, though, is at $65. As things stand, the market’s velocity is positioned halfway between the upside and the downside. It is recommended that investors hold onto their positions in anticipation of any potential strong rallies.
LTC/USD Market
Key Levels:
Resistance levels: $80, $85, $90
Support levels:$65, $60, $55
LTC/USD – Daily Chart
The LTC/USD daily chart reveals that the crypto-economic trade pushes lowly, pushing for a recovery around the middle of the Bollinger Band.
The Bollinger Band trend lines have been repositioned at higher-bound zones between $80 and $65. Two horizontal lines have been drawn to mark those values. The stochastic oscillators have turned the blue line northward, placing it around 55. The positional pattern of the indicators, however, portends that a rising force is going to continue.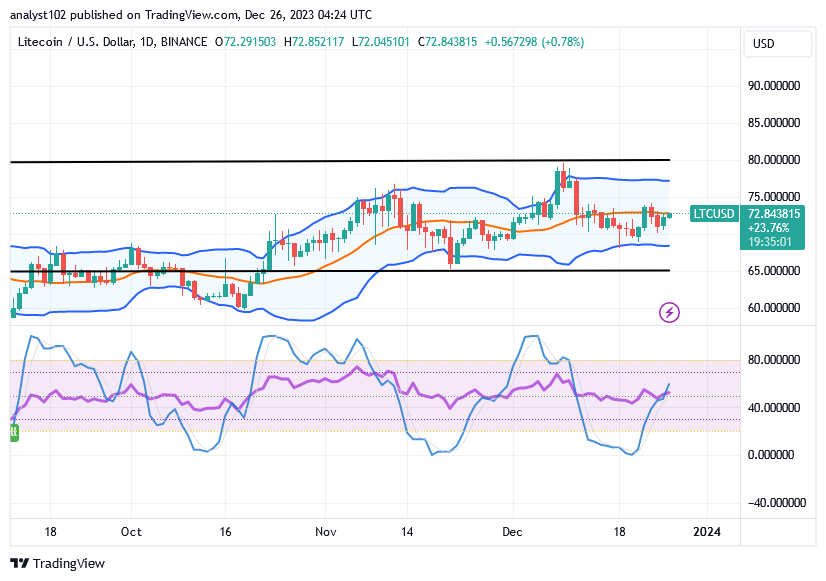
How fast are the buyers of LTC/USD right now, at $72.84, as the price hovers around the middle Bollinger Band?
The present trade zone has been achieved following the ability to regain strength from lower spots beneath the trend lines of the Bollinger Bands as the LTC/USD trade pushes lowly, pushing for a recovery.
Variant candlesticks have been featured to signify that bottoms have been creating to metamorphose into a swinging mode to give a promissory positive move in the projected operations. For a short while, the bouncing motions might move momentarily southward in an effort to gather momentum and push against some of the lost, important lines from the previous falling cycle.
The market is currently experiencing gravitational pressures, and as of the time of writing, a pause has been maintained. Most of the time, dropping price action supports such a decision, ideally inclining sellers to reclaim respectable entries. Sellers will have to wait a few days to see when there will be a line of rejections if abrupt northward forces occur.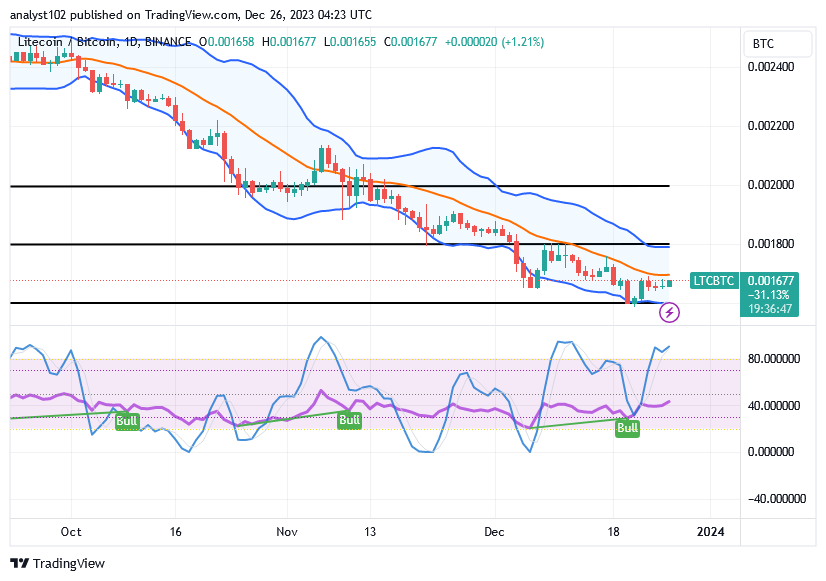
LTC/BTC Price Analysis
In contrast, the Litecoin trade pushes lowly against the worth of Bitcoin, pushing for a recovery tightly beneath the middle Bollinger Band.
The blue line on the stochastic oscillators is situated in the overbought area. Purchasing candlesticks repeatedly will indicate that the base cryptocurrency is consolidating in relation to the counter-crypto market. The Bollinger Band trend lines continue to point south, indicating the pair of instruments’ bearish trend. However, it is anticipated that forces for an uprising will win in the long run.
Note: Cryptosignals.org is not a financial advisor. Do your research before investing your funds in any financial asset or presented product or event. We are not responsible for your investing results.
You can purchase Lucky Block here. Buy LBLOCK