Litecoin (LTC/USD) Price Is Settling Above $65, Following a Correction
Estimated Reading Time: 3 minutes
Don’t invest unless you’re prepared to lose all the money you invest. This is a high-risk investment and you are unlikely to be protected if something goes wrong. Take 2 minutes to learn more
Litecoin Price Prediction – December 20
A series of lighter trade movements have characterized the method that bears have been pushing in the activities of Litecoin versus the valuation of the US Dollar, as the price is currently settling above $65, following a correction.
The impulsive price waves have been successful in gaining some trading areas and creating upward routes over time. To keep that mindset going, long-position placers need to gather momentum between $70 and $65 in order to get ahead of any good upswing movements the market may encounter in the ensuing operations. Consequently, that is an invitation for investors to step in at this particular moment.
LTC/USD Market
Key Levels:
Resistance levels: $80, $85, $90
Support levels:$65, $60, $55
LTC/USD – Daily Chart
The LTC/USD daily chart reveals that the crypto market is settling above the point of $65, following a correction.
The Japanese candlesticks took a falling force from a resistance zone of $80 in the last several days to now feature around $71.06 or thereabouts. The stochastic oscillators have the blue part of the lines inside the oversold region, denoting that sellers are liable to give up if they tend not to bring about a consolidation movement style against the present market value. The Bollinger Bands trend lines are relatively positioned northward at the points of $80 and $65. Those are the critical values against seeing more ups or downs, as the case may eventually be.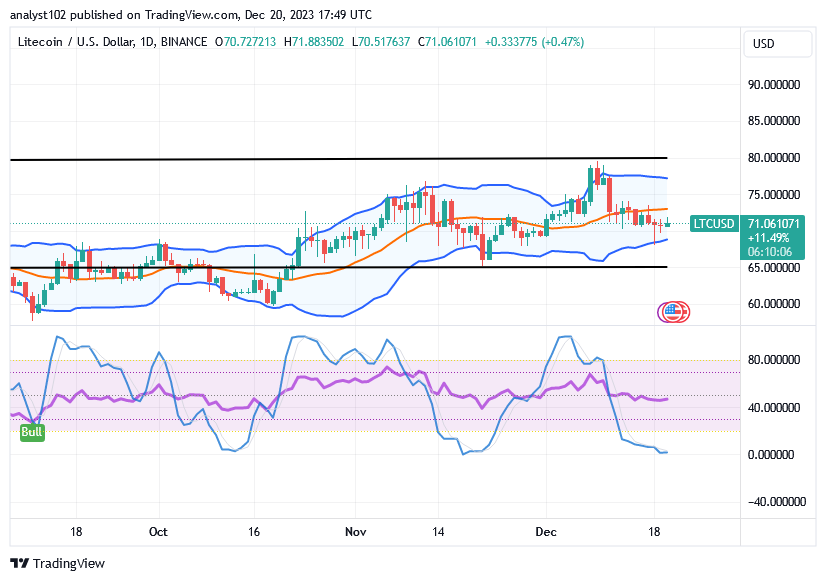
Will the LTC/USD market see further declines in the near future that go beyond the $65 underlying support level?
We do not expect more sustainable downward running of the price in the LTC/USD trade at this point, given that the cryptocurrency’s price is settling above the point of $65, following a correction from the topside of the upper Bollinger Band.
As it stands, bulls in the market might be holding off longer before panicking and retreating to the north side between the center and the $65 support line. In the process, a tight touch on the lower side of the Bollinger Band may eventually provide a respectable rebound entry for buyers to exploit.
For a while, sellers may be able to try to extend the lower Bollinger Band trend line to $65, depending on a smart negotiating situation, to test a point around the middle of the trend line. In the long term, there may be little chance of seeing consistent lower lows.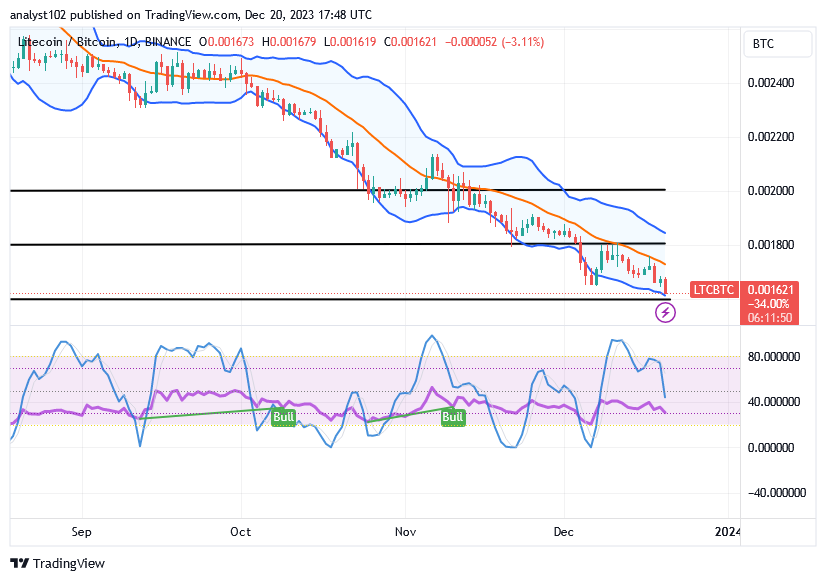
LTC/BTC Price Analysis
In contrast, the Litecoin price is settling around the lower Bollinger Band against the worth of Bitcoin, following a lengthy line of correction.
The Bollinger Bands’ positioning pattern suggests that the base cryptocurrency has continued to devalue in relation to its counterpart. The blue line of the stochastic oscillators is situated near the value of 40, southward, above its second section. That indicates a possible continuation of a declining trend. It can take some time for buyers to obtain more values during the oscillators’ adjustment back toward the north.
Note: Cryptosignals.org is not a financial advisor. Do your research before investing your funds in any financial asset or presented product or event. We are not responsible for your investing results.
You can purchase Lucky Block here. Buy LBLOCK