Quant Price Prediction: QNT/USD Moves Near $145 Resistance
Estimated Reading Time: 3 minutes
Don’t invest unless you’re prepared to lose all the money you invest. This is a high-risk investment and you are unlikely to be protected if something goes wrong. Take 2 minutes to learn more
Quant Price Prediction – February 20
The Quant price prediction shows that QNT is shooting close to $145 as it has done little to flip the market sentiment at this stage.
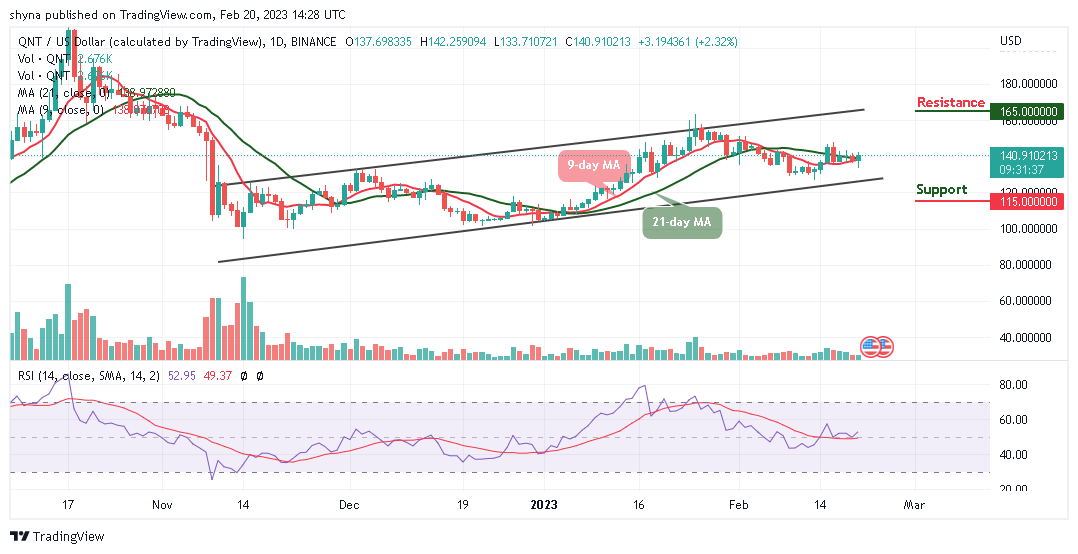
QNT/USD Long-term Trend: Bullish (Daily Chart)
Key levels:
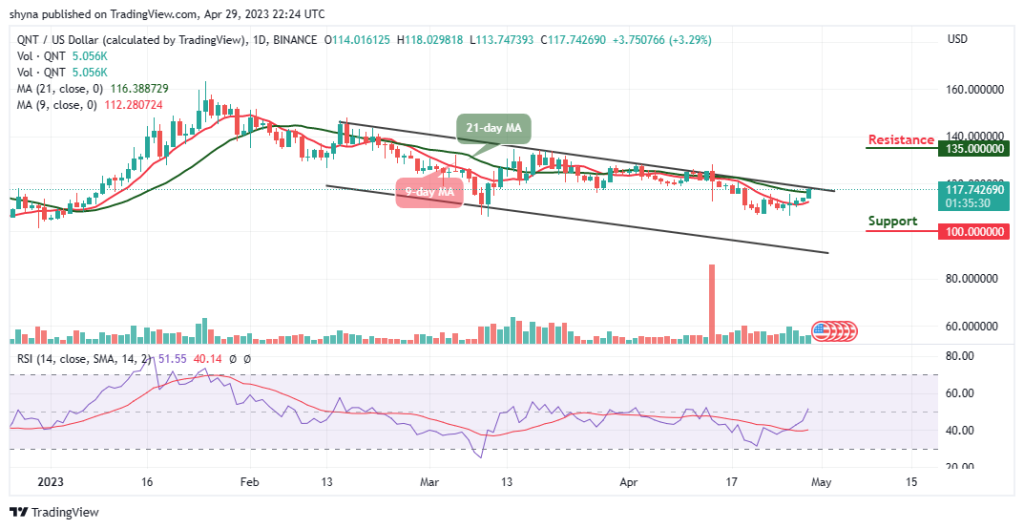
Resistance Levels: $165, $175, $185
Support Levels: $115, $105, $95
Looking at the daily chart, QNT/USD is correcting gains from $133 and it is likely to start a new increase as long as there is no close below $130. During the European session today, the Quant price sees a steady increase above the $138 resistance level as the coin is currently hovering at $140.9. At the moment, the Quant price is crossing above the 9-day and 21-day moving averages.
Quant Price Prediction: QNT Price Ready to Create More Ups
The Quant price is seen retracing and trading above the moving averages as the market price stays under the daily high of $142.25 resistance as a sign of bullish momentum. Moreover, a further increase in the bullish momentum may have to increase the price above this level; another resistance may come at $150 before reaching the potential resistance of $165, $175, and $185 levels.
However, if the resistance level of $140 failed to hold, the coin may reverse and face the support level at $135; further increase in the bears’ pressure may push down the price below the lower boundary of the channel and possibly hit the critical supports at $115, $105, and $95. Meanwhile, the technical indicator Relative Strength Index (14) signal line is moving above the 50-level to indicate a more bullish movement.
QNT/USD Medium-Term Trend: Ranging (4H Chart)
According to the 4-hour chart, the Quant price is seen trading above the 9-day and 21-day moving averages at $141.14. At the time of writing, the Quant price is moving towards the upper boundary of the channel but any bearish cross below the moving averages may drag the coin to the support level of $135 and below.
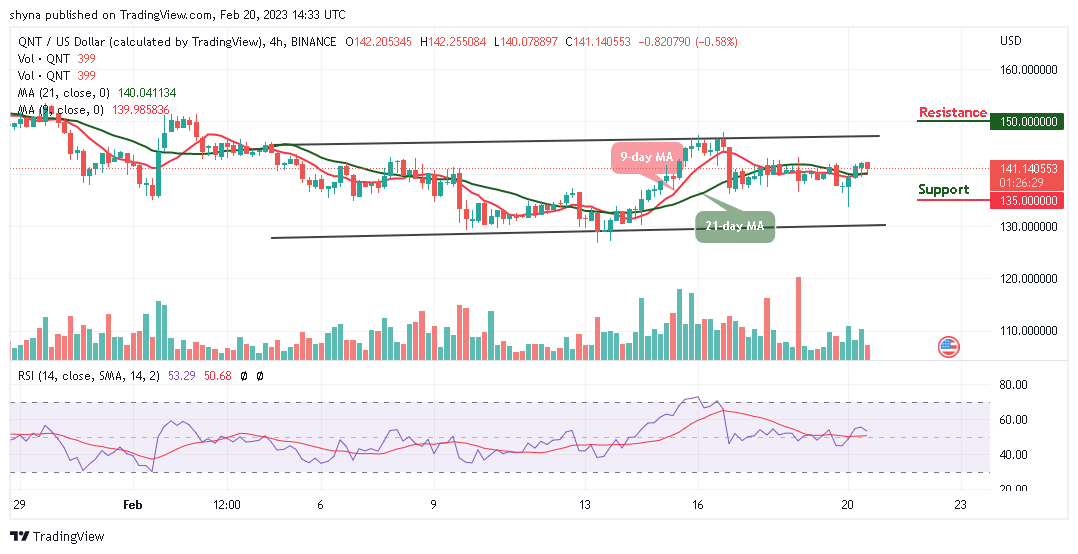
Nevertheless, if QNT/BTC finds a decent resistance level around $145 level, it may start another bullish movement towards the upper boundary of the channel which could reach the resistance level of $150 and above. In other words, the technical indicator Relative Strength Index (14) is seen moving below the 60-level, suggesting a bearish signal.
Place winning Quant trades with us. Get QNT here