QNT/USD Price Forecast: Quant Ready for Spike to the Upside
Estimated Reading Time: 3 minutes
Don’t invest unless you’re prepared to lose all the money you invest. This is a high-risk investment and you are unlikely to be protected if something goes wrong. Take 2 minutes to learn more
Quant Price Prediction – February 11
The Quant price prediction shows that QNT will begin to face moderate volatility toward the 9-day and 21-day moving averages.
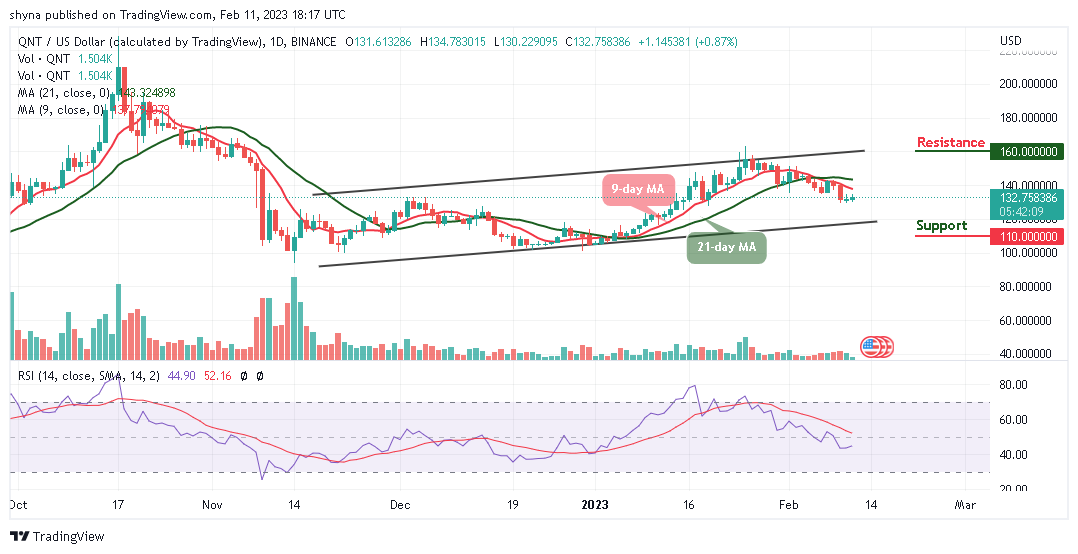
QNT/USD Long-term Trend: Ranging (1D Chart)
Key Levels:
Resistance levels: $160, $170, $180
Support levels: $110, $100, $90
QNT/USD is trading around the $132.75 level below the 9-day and 21-day moving averages. The Quant price is consolidating within the channel and the closest support could be located at $120. Meanwhile, if the bullish movement increases, the nearest resistance level of $140 could be found.
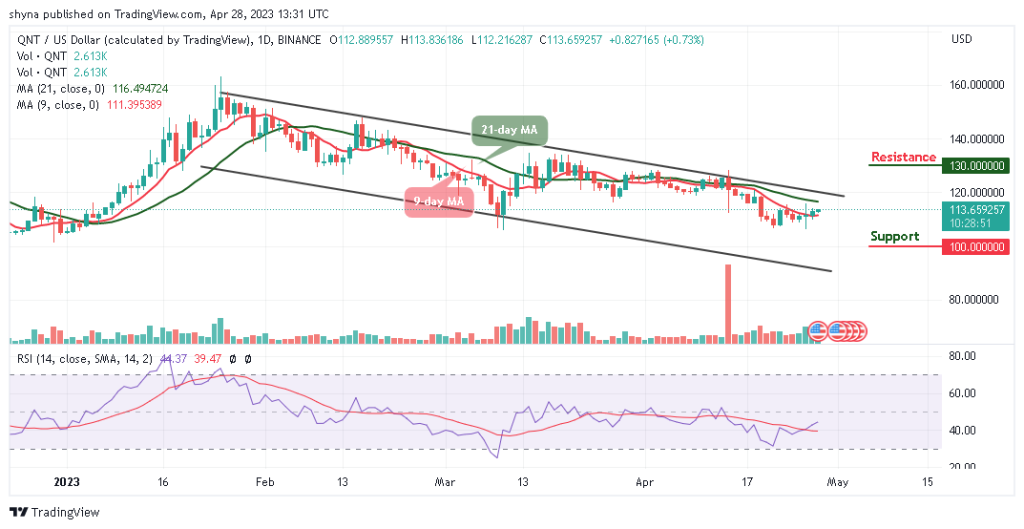
Quant Price Prediction: QNT Price Ready for the Upside
The Quant price will begin to create bullish trends once the coin crosses above the 9-day and 21-day moving averages while the technical indicator Relative Strength Index (14) moves to cross above the 50-level.
At the moment, QNT/USD is moving moderately within the channel, but if the coin slides toward the lower boundary of the channel, it could touch the nearest support level of $125. On that note, any further bearish movement can hit the supports at $110, $100, and $90, while the potential resistance levels could be located at $160, $170, and $180 respectively.
QNT/USD Medium-term Trend: Ranging (4H Chart)
According to the 4-hour chart, the Quant price could make a bullish cross above the 21-day moving average, if the bulls increase the buying pressure. However, if the Quant price crosses above the channel’s upper boundary, it could hit the nearest resistance at $140. Meanwhile, if the coin slides below the moving averages, it could head toward the lower boundary of the channel, crossing below this barrier can hit the critical support at $125 and below.
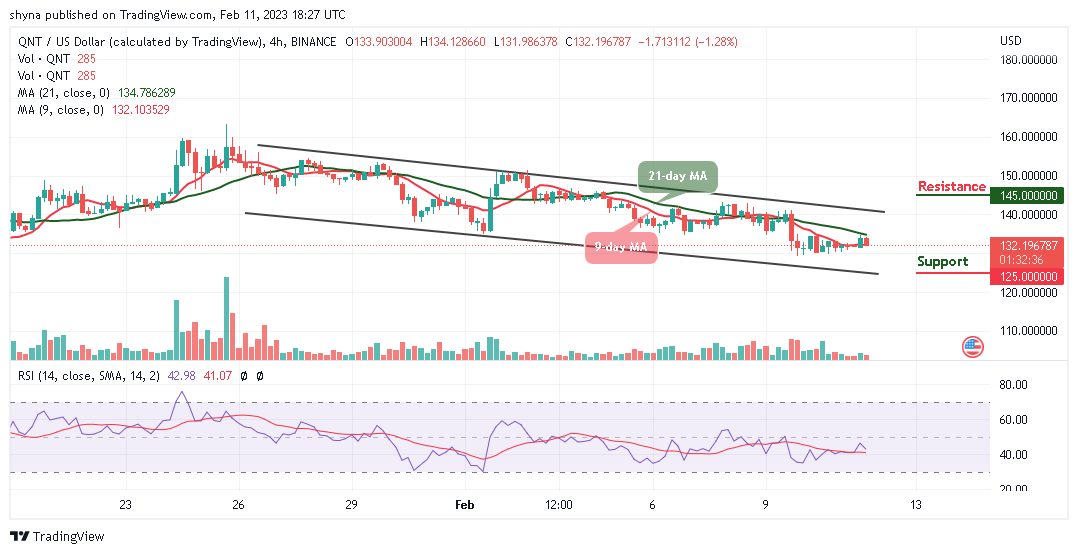
Moreover, any bullish movement above the upper boundary of the channel may increase the bullish movement within the channel, and this can touch the potential resistance level at $145 and above. Still, the technical indicator Relative Strength Index (14) can cross below the 40-level, suggesting downward movement.
Place winning Quant trades with us. Get QNT here