Wall Street Memes (WSM) Trade Is Firmly, Nurturing Bounces
Estimated Reading Time: 3 minutes
Don’t invest unless you’re prepared to lose all the money you invest. This is a high-risk investment and you are unlikely to be protected if something goes wrong. Take 2 minutes to learn more

Wall Street Memes Price Prediction – August 6
Owing to lesser forces of the system that the WSM market purchasers have put in place against the power of the US currency, the crypto-economic trade is now firmly nurturing bounces in its outlook.
Long-term investors are now urged to reevaluate their holding strategies, as the WSM/USD market begins to consolidate around the $0.0006 mark, signaling a critical juncture that may shape upcoming price behavior—creating added pressure that might prompt consideration of selling rather than simply clinging to conviction. However, buyers shouldn’t entirely lose hope, as this zone still holds potential for a bullish turnaround.
WSM/USD Market
Key Levels
Resistance levels: $0.0008, $0.0009, $0.001
Support levels: $0.0005, $0.0004, $0.0003
WSM/USD – 4-hour Chart
The medium-term chart of the WSM/USD market is now firmly around $0.0006, nurturing bounces in its moving style.
The stochastic oscillators have moved southbound, attempting to get a repositional order toward the oversold region. The Bollinger Bands indicators are in a slight-losing mode at the lower part, indicating the degree of energy recouping gradually proceeding in the overall crypto market trend.
Should Sellers Resist Dumping WSM/USD at \$0.0006 and Exercise Caution Amid Potential Rebound Signals?
Sellers should hold off, as current stabilization suggests an imminent upsurge could emerge from the $0.0006 level soon, as the WSM/USD market is firmly at its base, nurturing bounces.
WSM/USD market participants who may have been cautiously holding back over several sessions must now begin shifting strategic attention toward re-engaging the market ahead of an anticipated, massive rebound—one projected to be historically unprecedented in both momentum and scope, given the prevailing structural setups.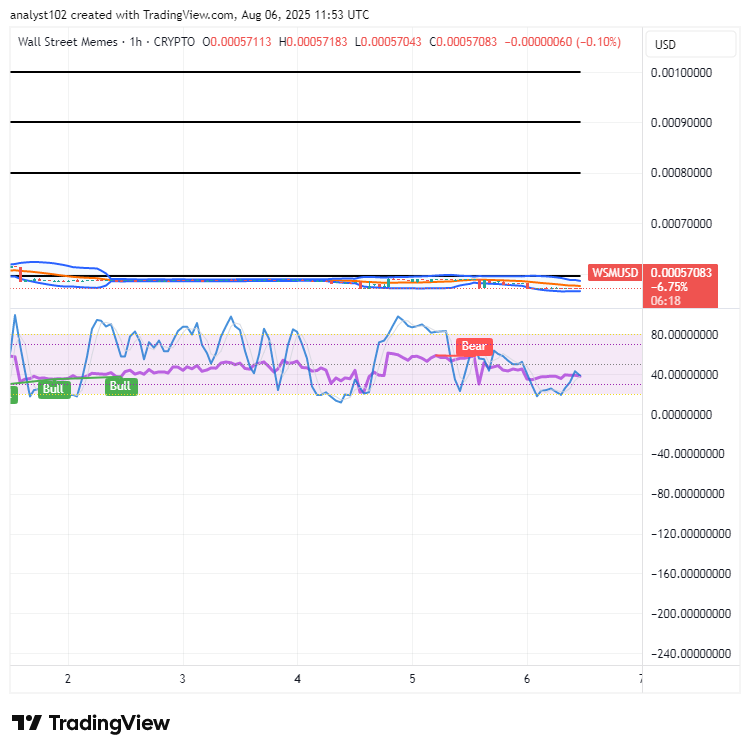
WSM/USD 1-hour chart
The 1-hour chart of the WSM/USD price is now firmly around $0.0006, nurturing bounces in its moving style.
The Bollinger Bands indicators have stylishly gotten recomposed downward, aligning with the boundary of range zones, hinting at an upcoming volatility burst. The stochastic oscillators are now having a posture of staying under a merely bearish outlook, awaiting decisive momentum confirmation soon.
$WSM/$USDT is now tradeable on #Bybit Perpetuals, offering dynamic exposure and flexible leverage for strategic traders.
$WSM community, we saw your Tweets! 👏$WSM / $USDT is now tradeable on #Bybit Perpetuals.
— Bybit (@Bybit_Official) October 13, 2023
Trade here: https://t.co/le4XyVyXaZ
Also want your project listed? Share your suggestions here:https://t.co/W7EWJVVNV5 https://t.co/XgXoL7g0rF