Dogecoin (DOGE/USD) Bullish Momentum Slows Down $0.250: Possible Price Consolidation
Estimated Reading Time: 3 minutes
Don’t invest unless you’re prepared to lose all the money you invest. This is a high-risk investment and you are unlikely to be protected if something goes wrong. Take 2 minutes to learn more
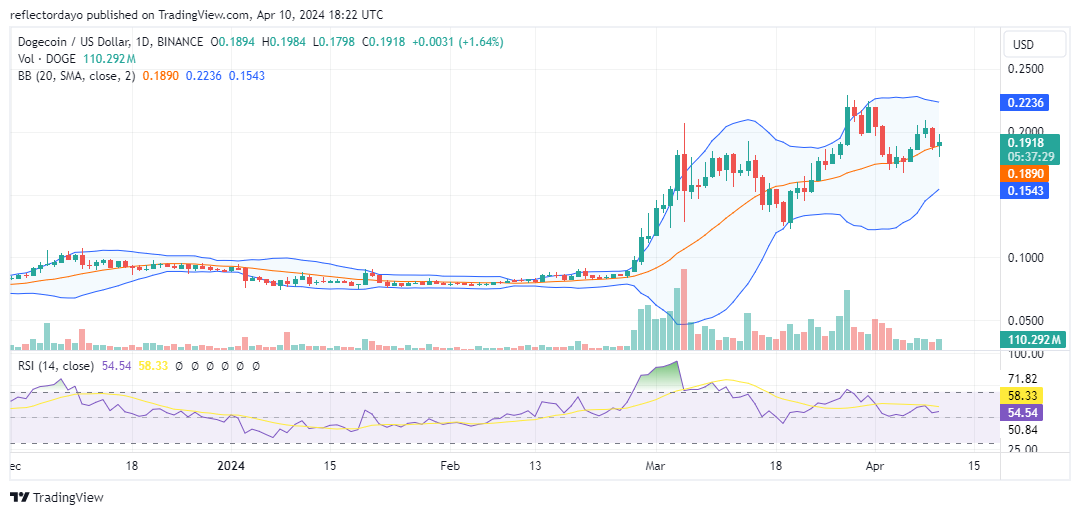
The Dogecoin market has maintained stability at the $0.0829 price level since January. However, in March, the market witnessed heightened activity characterized by sudden and aggressive buying, leading to a significant surge in price, surpassing both the $0.10 and $0.20 price thresholds. The breach of the $0.10 level sparked a notable surge in trader interest, as this level had previously served as a longstanding resistance point. Presently, the market is encountering substantial resistance at the $0.20 price level, posing a formidable challenge to the current strong price surge.
Dogecoin Market Data
- DOGE/USD Price Now: $0.1935
- DOGE/USD Market Cap: $27 billion
- DOGE/USD Circulating Supply: 143.83 billion
- DOGE/USD Total Supply: 143.83 billion
- DOGE/USD CoinMarketCap Ranking: #8
Key Levels
- Resistance: $0.25, $0.30, and $0.35.
- Support: $0.15, $0.10, and $0.05.
Dogecoin Market Analysis: The Indicators’ Point of View
The $0.20 price level has persisted as a resistance point since March, coinciding with the arrival of the Dogecoin bull market. Initially, bears seized opportunities at this level to capitalize on volatility, pushing the market downward. However, after finding support at $0.13, the price rebounded yet remained unable to breach the $0.20 barrier. Presently, as indicated by the convergence of Bollinger Bands, market volatility appears to be declining alongside a reduction in bullish momentum. This convergence suggests two potential outcomes: either a bearish price reversal or a consolidation phase at $0.20. Notably, today’s trading activity, represented by a spinning top candlestick, hints at the likelihood of consolidation at $0.20, with supply and demand reaching a balanced state.
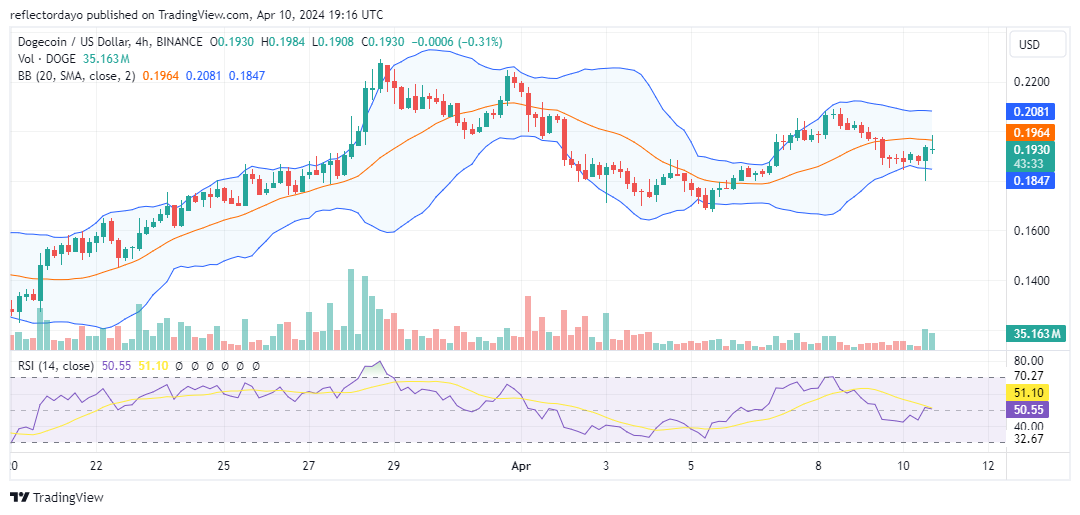
DOGE/USD 4-Hour Chart Outlook
The Dogecoin crypto signal from this perspective is currently exhibiting a consolidation phase around the $0.20 resistance level when viewed over a smaller timeframe. The Relative Strength Index (RSI) reflects this phase by hovering around the 50 level, indicating a state of equilibrium at the present price. If demand continues to align closely with supply, trading volume may decline, leading to a narrowing of the Bollinger Bands in preparation for a discernible price movement in a defined direction.