UMA (UMAUSD) Is Struggling Around the $12.000 Price Level
Estimated Reading Time: 3 minutes
Don’t invest unless you’re prepared to lose all the money you invest. This is a high-risk investment and you are unlikely to be protected if something goes wrong. Take 2 minutes to learn more
UMA Analysis – Price Is Struggling to Move Clear of a Significant Level
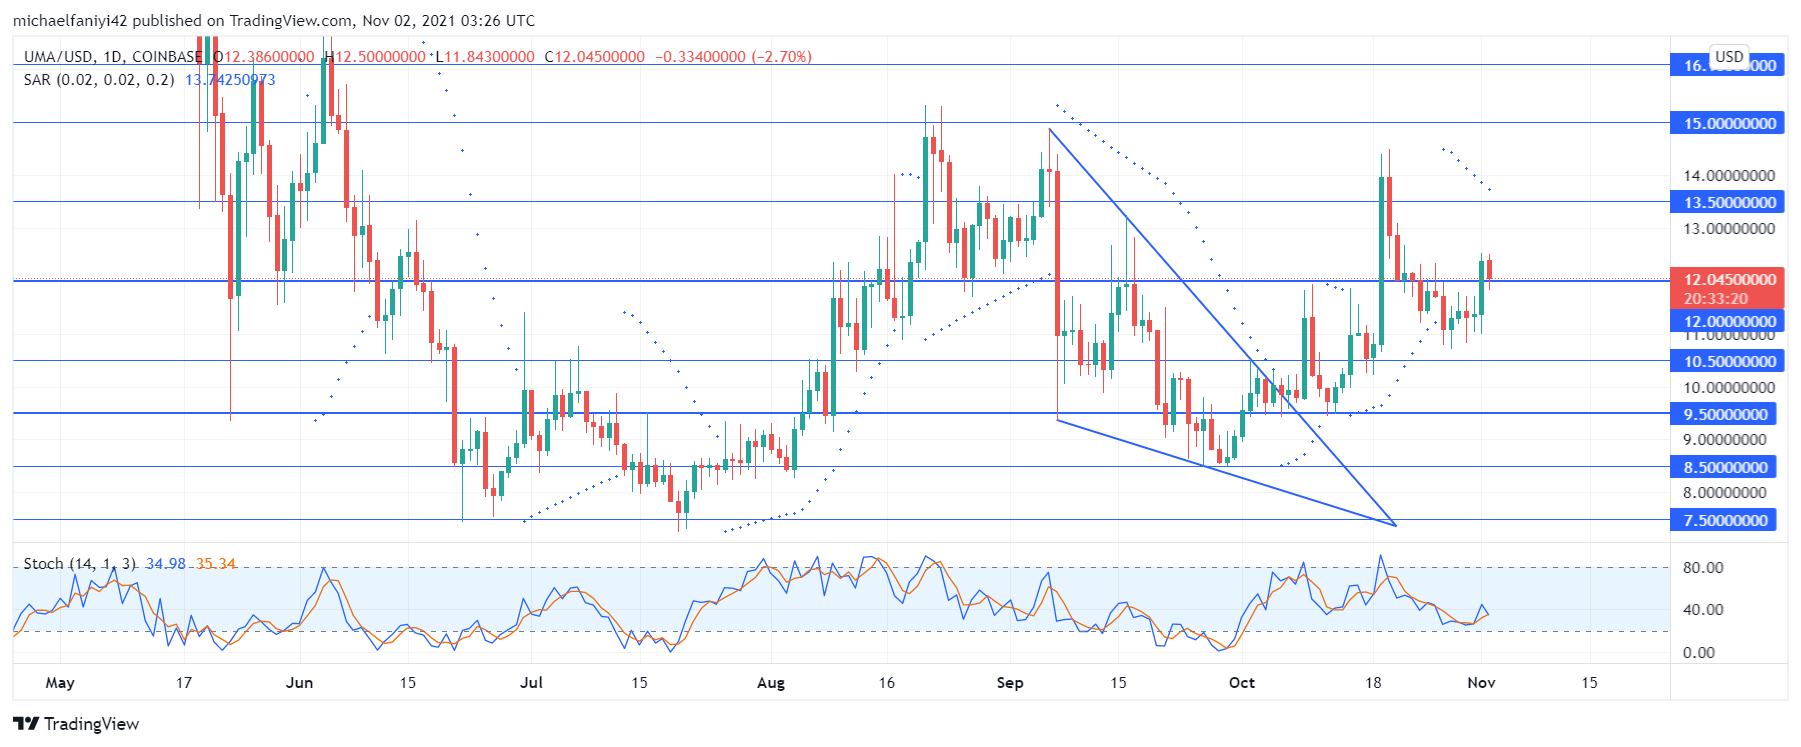
UMA is struggling to move clear of the $12.000 significant level and keeps fluctuating around it. The market made a higher low by climbing to the $12.000 price level. From this level, UMA spiked up, breaking past the $12.000 and $13.500 price levels. However, after struggling to make further movement upward, the coin retraces and slides back under the $12.000 key level, where it has now been struggling to make headway.
UMA Critical Levels
Resistance Levels: $13.500, $15.000, $16.100
Support Levels: $12.000, $10.500, $9.500
The market struggled to resist bearish pressure as the coin was gradually squeezed downward through a descending triangle. Price would eventually edge out, through the $9.500 support level. The coin leaped immediately but it was halted at $12.000. Though the price dropped, it took a step upward to a higher low of $10.500, where it surges upward again, this time breaking multiple key levels.
UMA drops back below $12.000, but it is now struggling around this level. Though the coin still makes a higher low, it has been repressed from moving higher. This is a result of the waning influence of the bulls in the market. The Stochastic Oscillator shows that a retracement below $12.000 has plunged the coin into bearish territory and the Parabolic SAR (Stop and Reverse) shares the same sentiment as it begins placing its dots above the daily candles immediately after the price lingers to get above $12.000.

Market Prospects
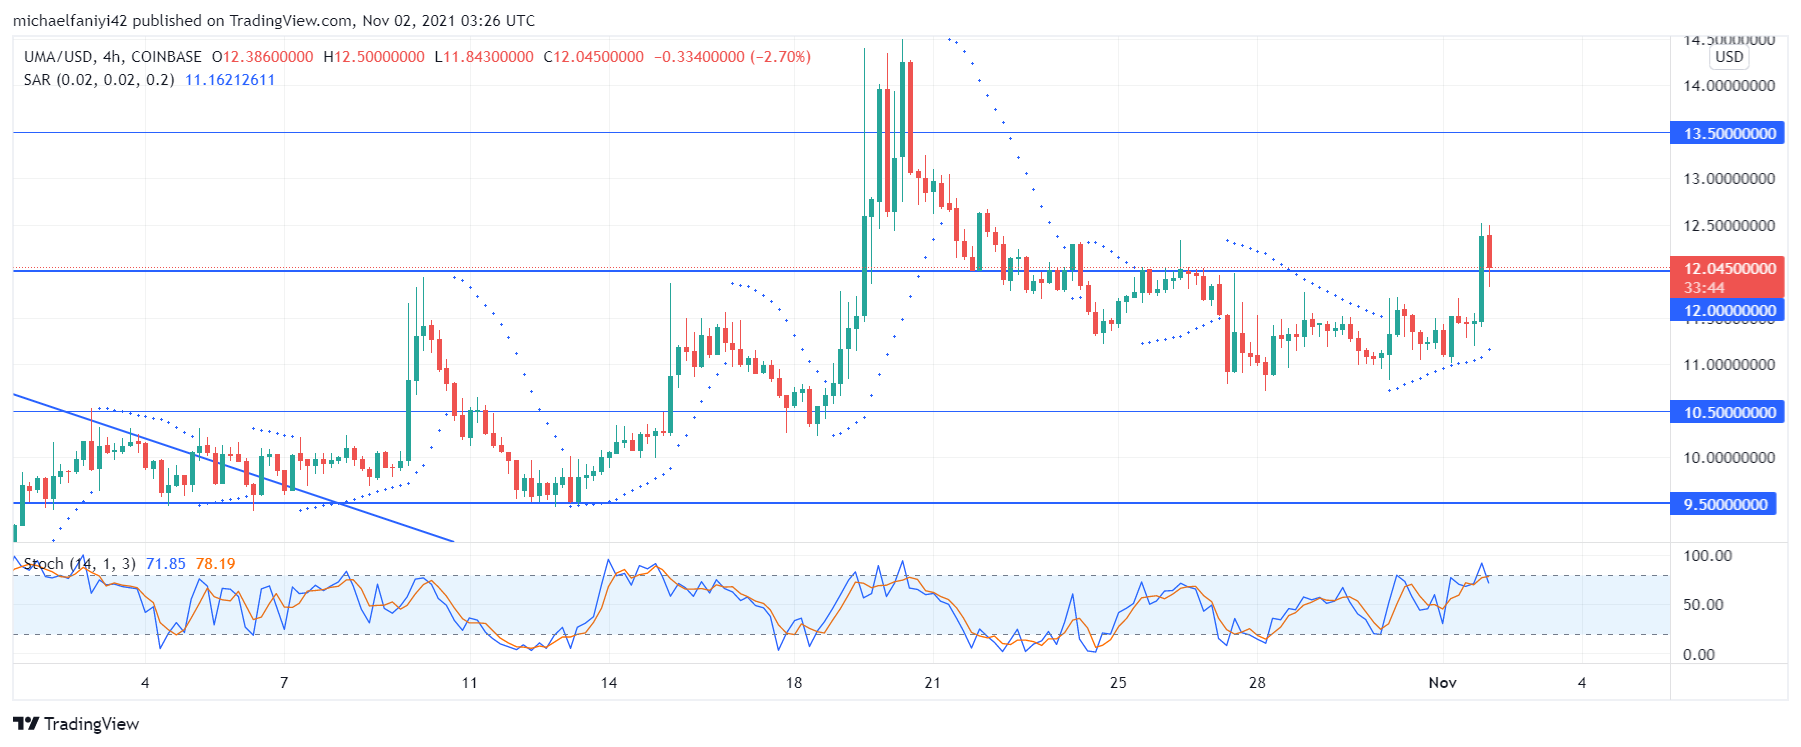
The 4-hour chart shows that, on the smaller time frame, bulls are making progress upward after a sustained period of struggling to initiate an upward reversal. The Parabolic SAR has placed its dots below the 4-hour candlesticks to signify a market reversal upward. The Stochastic Oscillator has its line also wobbling upward toward the overbought region border.
Though still struggling, UMA is expected to hold above $12.000, which will enable it to spring upward past $13.500.
You can purchase crypto coins here: Buy Tokens
Note: Cryptosignals.org is not a financial advisor. Do your research before investing your funds in any financial asset or presented product or event. We are not responsible for your investing results.