Fetch.ai (FET/USD) Market Consolidates at $0.181 Ahead of a Rebound
Estimated Reading Time: 2 minutes
Don’t invest unless you’re prepared to lose all the money you invest. This is a high-risk investment and you are unlikely to be protected if something goes wrong. Take 2 minutes to learn more
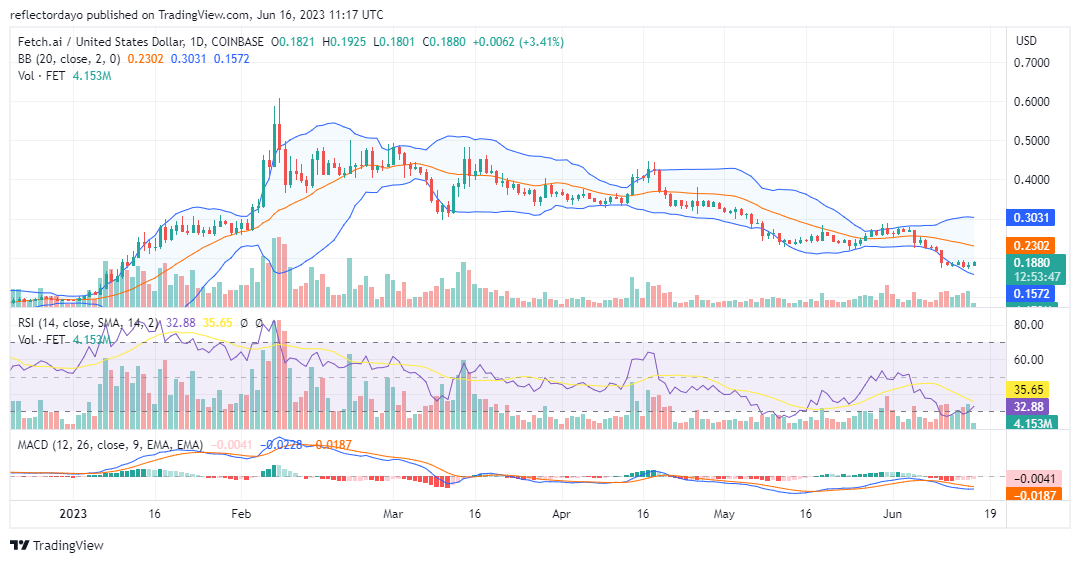
Since June 10, after the Fetch.ai market hit the $0.181 support level, it has continued to range sideways from this level due to indecision among traders. But because this consolidation is taking place around the key support level, the market is more likely to rebound than continue the bearish run.
FETUSD Market Data
- FET/USD Price Now: $1892
- FET/USD Market Cap: $153,642,774
- FET/USD Circulating Supply: 821,195,670
- FET/USD Total Supply: 1,152,997,575
- FET/USD CoinMarketCap Ranking: #145
Key Levels
- Resistance: $0.30, $0.35, and $0.40
- Support: $0.15, $0.10, and $0.09.
Price Prediction for Fetch.ai: The Indicators’ Point of View
However, when we look at the market from another perspective, the Fetch.ai bears may still have some chance to push the bear market a bit further. When we consider the historical data as presented on the daily chart, since the market hit its April high at $0.45, the bear market has been pushing through a number of support levels it encountered on its way. Therefore, based on this, we may say that bears may likely break through the $0.181 support level as well. But looking at the market from the perspective of the Relative Strength Index (RSI), we can conclude that buyers may start buying massively at the current level. This is because the market, moving along the edge of the oversold region, is more likely to rise than fall.
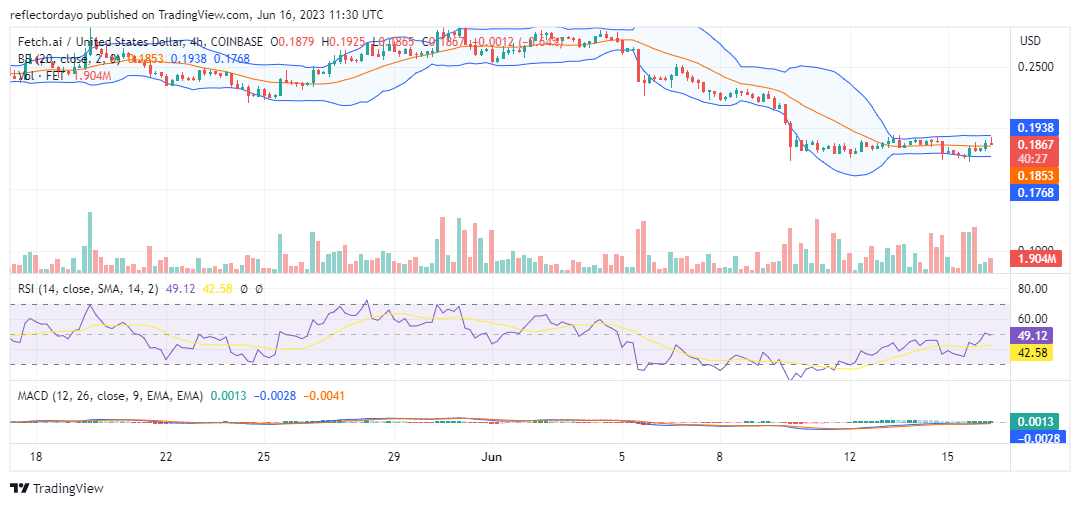
FET/USD 4-Hour Chart Outlook
In the 4-hour timeframe, the Bollinger Bands indicator illustrates how the market enters a volatility squeeze on June 13. This was after the volatility of the market fell drastically. This means that the Fetch.ai bears may be losing momentum, and this will eventually give the bulls a chance to take the market. Already, the market is back in equilibrium. What is needed now is for more bulls to enter the market so that the market may rebound.