Polygon (MATIC/USD) Price Keeps Positive, Finding a Baseline
Estimated Reading Time: 3 minutes
Don’t invest unless you’re prepared to lose all the money you invest. This is a high-risk investment and you are unlikely to be protected if something goes wrong. Take 2 minutes to learn more
Polygon Price Prediction – January 21
The tradeline has been set around the line of $75, closely averaging the support of $70, as the MATIC/USD market operation keeps positive, finding a baseline.
A bullish candlestick from yesterday’s trading session is bottoming in the area above the $70 line. As of right now, buying pressure is anticipated to be strong in the next few days, assuming that there isn’t a noticeable downward reversal against the lower Bollinger Band trend line. Using the position and posture of a 1-hour chart to detect rebounding sessions from a lower zone at a specific time, buyers are likely to remain more firmly against the point of shorting myths.
MATIC/USD Market
Key Levels:
Resistance levels: $0.90, $1, $1.10
Support levels: $0.70, $0.65, $0.60
MATIC/USD – Daily Chart
The MATIC/USD daily chart reveals that the crypto-economic trade keeps positive, finding a baseline around the lower Bollinger Band trend line.
The stochastic oscillators have been placed deeply in the oversold region, identifying that the dropping force on the market has been reaching an ideal maximal lower-trading capacity to denote that more shorting moves may tend not to surface. The Bollinger Band trend lines are in a tentative southbound-crossing mode, affirming that the trade basis will remain critical against any foreseeable southward gravitational forces.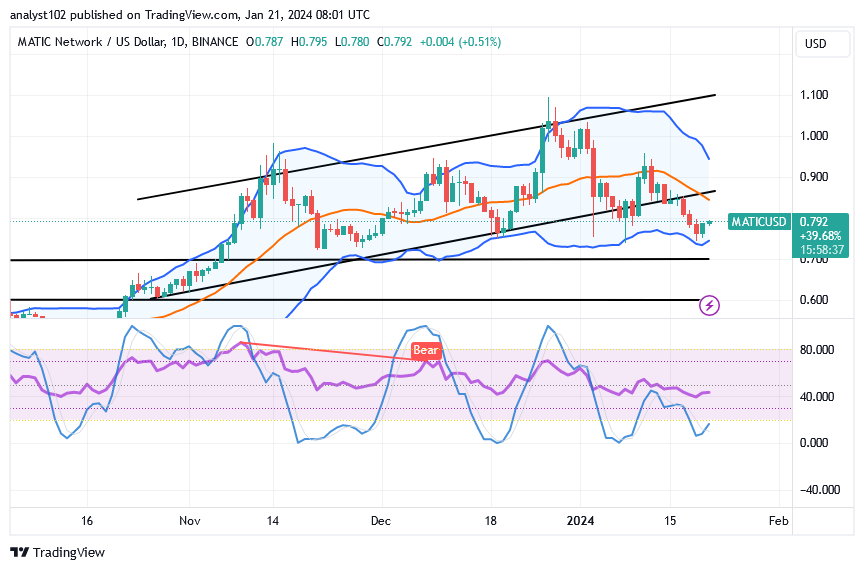
Given that the price index is still positive, should traders take a position higher or lower around the present price of $0.792?
As the price has been able to locate a footstep around the point of $75, it is likely for long-position pushers to uphold firm stances, given that the MATIC/USD market keeps positive, finding a baseline.
The key barrier preventing the potential for future lows to recover respectable long-term position orders is the baseline that has been drawn around the $70 mark. Buyers who pursue allowing bulls to continue rebuilding their postures may encounter a series of movements to the south.
At the midpoint of the middle Bollinger Band trend line, the trade barrier line has been reset. The predicted areas to see a rebound are expected to be the bargaining resistance points between $0.90 and $1. As things stand, we do not advise sellers to proceed southerly against the lower Bollinger Band zone. The final decision in place is that short sellers should exercise caution while enforcing new orders to negate the postives.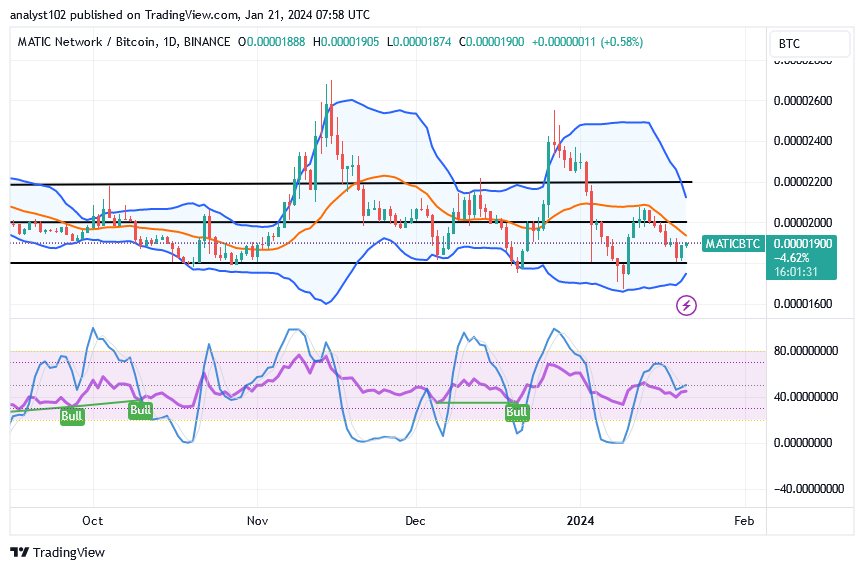
MATIC/BTC Price Analysis
In comparison, the Polygon trade keeps positive against the line of Bitcoin, finding a baseline close to the point of the lower Bollinger Band.
The Bollinger Band indicators are positioned in a way that demonstrates the creation of vast range-bound locations to identify the maximum points at which the base and quotient instruments can move in either direction. The layout of the stochastic oscillators indicates that a move toward rebellion will be highly successful in the ensuing activities.
Note: Cryptosignals.org is not a financial advisor. Do your research before investing your funds in any financial asset or presented product or event. We are not responsible for your investing results.
You can purchase Lucky Block here. Buy LBLOCK