Polkadot Falls Above $6.80 As Bears Try To Short Deeper
Estimated Reading Time: 2 minutes
Don’t invest unless you’re prepared to lose all the money you invest. This is a high-risk investment and you are unlikely to be protected if something goes wrong. Take 2 minutes to learn more

Polkadot (DOT) Long-Term Analysis: Bearish
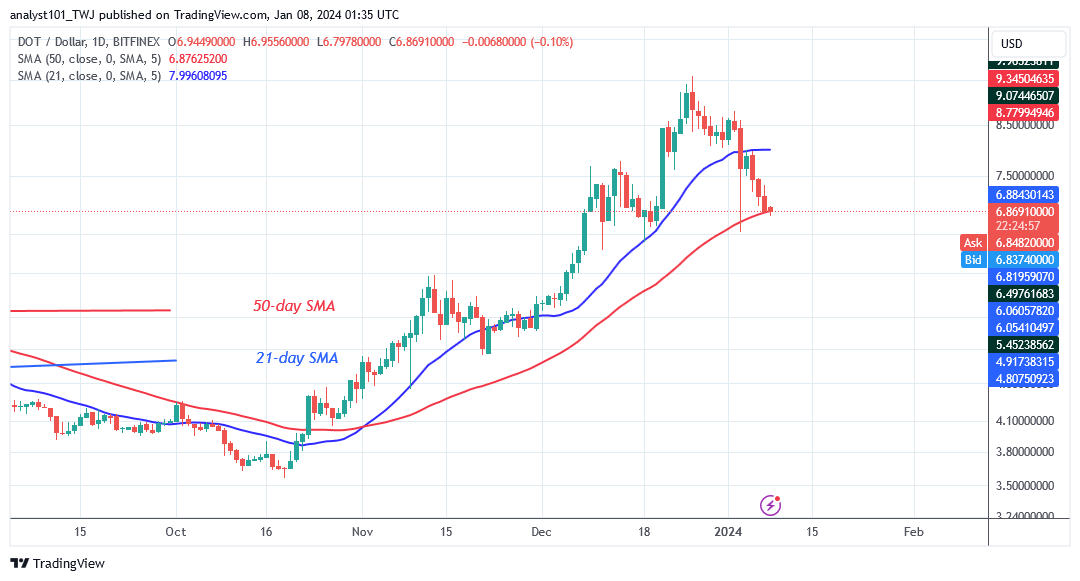
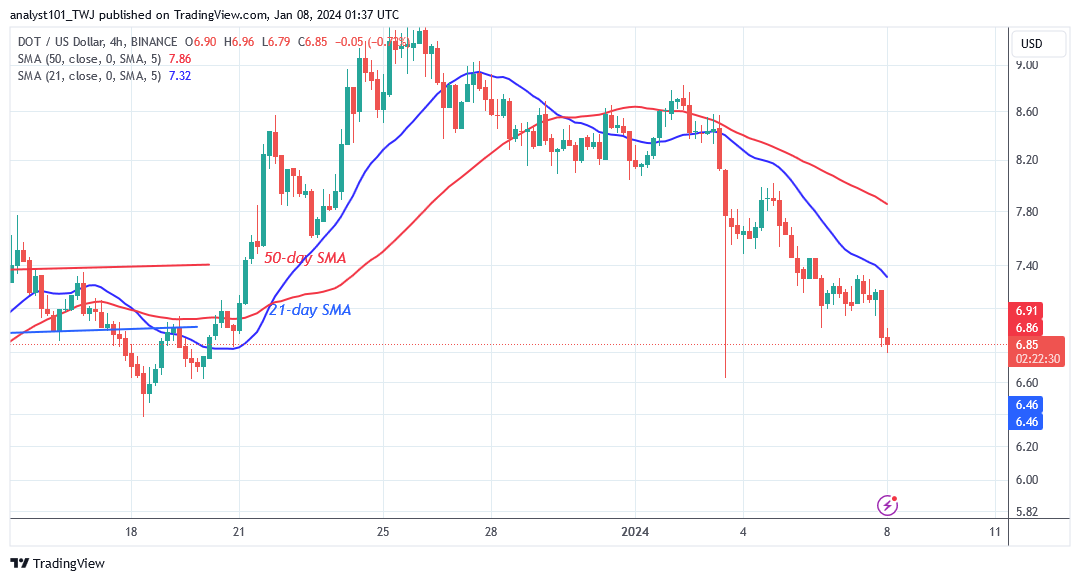
Polkadot (DOT) is being rejected at the $9.58 high as bears try to short deeper. The crypto’s price briefly fell below the moving average lines on January 3 before rising again. The price of the cryptocurrency is stuck between the lines of the moving average. The current price of the coin is $7.23 as of this writing. Buyers will reestablish market optimism if they can keep the altcoin’s price above the 21-day SMA.
The altcoin will increase and return to its earlier peak. The negative momentum has diminished above the 50-day SMA on the downside. If the bear breaks below the 50-day SMA support, Polkadot will start selling pressure again. The cryptocurrency will drop even lower, reaching a low of $5.87.
Technical indicators:
Major Resistance Levels – $10, $12, $14
Major Support Levels – $8, $6, $4
Polkadot (DOT) Indicator Analysis
The price bar of Polkadot is trapped between the lines of the moving average. The tail of the extended candlestick on January 3 shows significant support above the 50-day SMA. The moving average lines on the 4-hour chart are trending southward, signifying the drop.
What Is the Next Direction for Polkadot (DOT)?
Polkadot has been dropping as bears try to short deeper. Since December 11, the 50-day simple moving average, or $6.80, has functioned as a critical support level. If the current support holds, the current decline will come to an end. The market will begin to rise. In other words, the price of DOT will rise to retest or surpass the 21-day SMA.
You can purchase Lucky Block here. Buy LBLOCK
Note: Cryptosignals.org is not a financial advisor. Do your research before investing your funds in any financial asset or presented product or event. We are not responsible for your investing results