Polkadot Price Update: Rising Trend Pauses above $8.00
Estimated Reading Time: 2 minutes
Don’t invest unless you’re prepared to lose all the money you invest. This is a high-risk investment and you are unlikely to be protected if something goes wrong. Take 2 minutes to learn more

Polkadot (DOT) Long-Term Analysis: Bullish
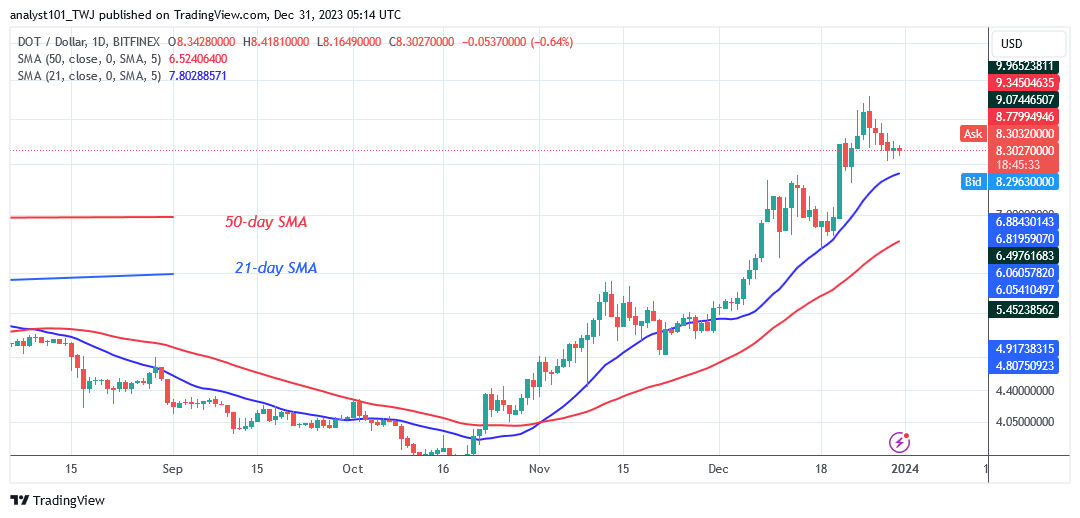
Polkadot (DOT) is retracing as it pauses above $8.00. Today, the altcoin has dropped to a low of $8.28 and may decline further. On the downside, if DOT price retraces above the 21-day SMA, it will resume its bullish ascent. The cryptocurrency will soar once more, approaching the previous high of $9.58. However, the rising trend is shaky because the market has reached overbought territory.
Furthermore, if the price falls below the 21-day simple moving average, the slide would be accelerated. Meanwhile, DOT/USD is dropping slightly near the moving average lines.
Technical indicators:
Major Resistance Levels – $10, $12, $14
Major Support Levels – $8, $6, $4
Polkadot (DOT) Indicator Analysis
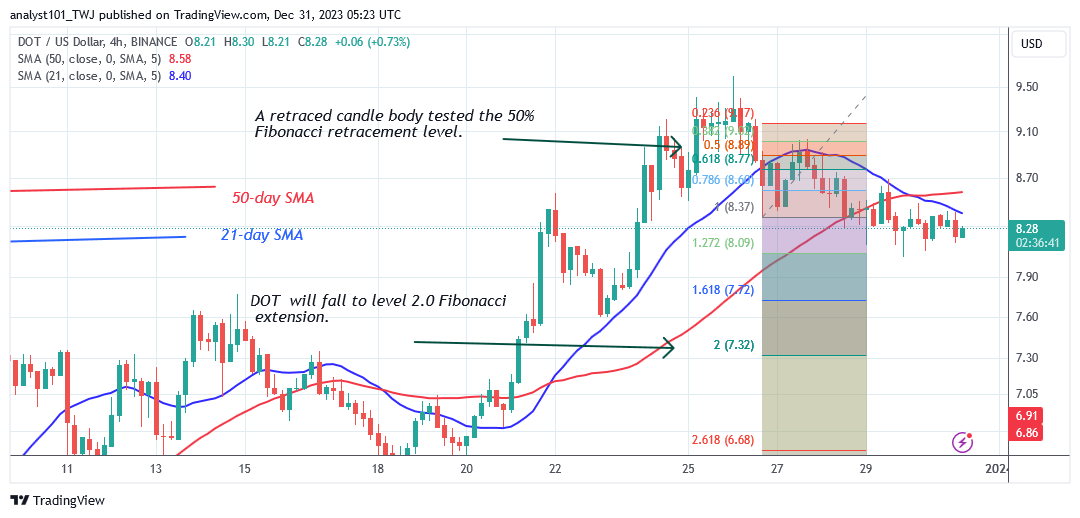
Polkadot’s price bars are above the moving average lines, indicating that the cryptocurrency may rise. However, the altcoin’s price will decline if it falls below the 21-day SMA. On the lower time frame, the price bars are below the moving average lines, indicating that the price will continue to fall.
What Is the Next Direction for Polkadot (DOT)?
On the 4-hour chart, Polkadot is declining below the moving average lines as it pauses above $8.00. On the 26th of December, the altcoin made an upward advance, and the candle body tested the 50% Fibonacci retracement level. This means that the market will continue to decline to the Fibonacci extension level of 2.0, or $7.32 low.
You can purchase Lucky Block here. Buy LBLOCK
Note: Cryptosignals.org is not a financial advisor. Do your research before investing your funds in any financial asset or presented product or event. We are not responsible for your investing results