Cardano Declines to $1.05 Low as the Market Reaches $1.20 High
Estimated Reading Time: 2 minutes
Don’t invest unless you’re prepared to lose all the money you invest. This is a high-risk investment and you are unlikely to be protected if something goes wrong. Take 2 minutes to learn more

Free Crypto Signals Channel

Cardano (ADA) Long-Term Analysis: Bullish
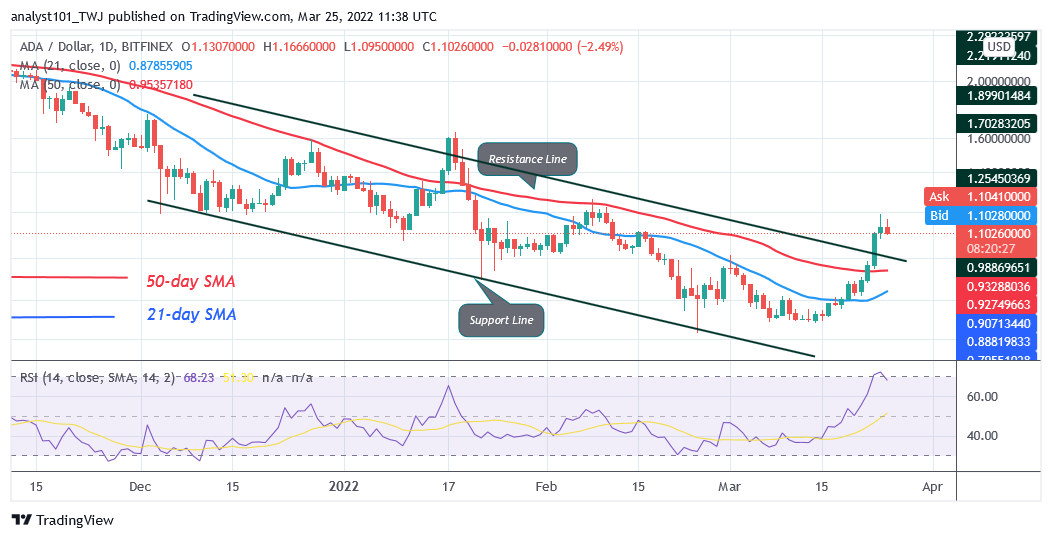
Cardano’s (ADA) price has broken above the moving averages as market reaches $1.20 high. Buyers were able to break the resistance $1.00 but were repelled at the $1.20 high. Today, ADA is retracing from the recent high. The upward move will resume if price retraces above the moving averages. However, the downtrend will resume if price breaks below the moving averages. On the upside, if price breaks above the $1.20 resistance, the market will rise to the high of $1.60. Today, the market has declined to $1.10 low at the time of writing.
Cardano (ADA) Indicator Analysis
Cardano is at level 72 of the Relative Strength Index for period 14. ADA price has reached the overbought region of the market. Sellers are likely to emerge in the overbought region to push prices down. The crypto will rise if the crypto’s price bars are above the moving averages. On the other hand, the altcoin will decline if price bars are below the moving averages. Similarly, ADA is below the 80% range of daily stochastic. ADA is in a bearish momentum.
Technical indicators:
Major supply zones: $2.0, $2.20, $2.40
Major demand zones: $1.40, $1.20, $1.00
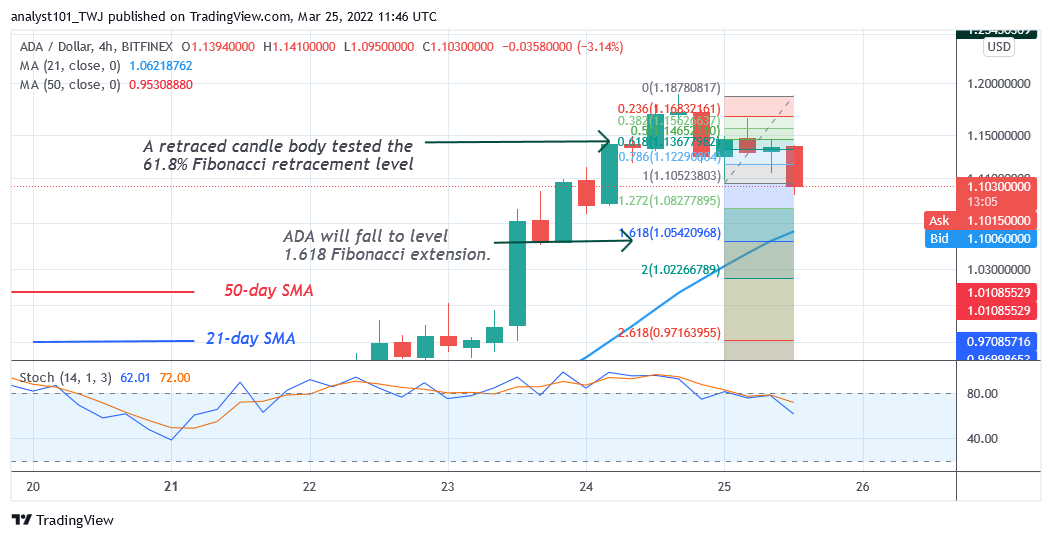
What Is the Next Direction for Cardano (ADA)?
ADA/USD is in an upward move as market reaches $1.20 high. ADA price is falling as the market reaches the overbought region. Meanwhile, on March 25 downtrend; a retraced candle body tested the 61.8% Fibonacci retracement level. The retracement suggests that ADA will fall to level 1.618 Fibonacci extension or $105.
You can purchase crypto coins here. Buy LBlock
Note: Cryptosignals.org is not a financial advisor. Do your research before investing your funds in any financial asset or presented product or event. We are not responsible for your investing results