Bitcoin (BTC/USD) Is Currently Trying to Break the $65,000 Resistance Level
Estimated Reading Time: 3 minutes
Don’t invest unless you’re prepared to lose all the money you invest. This is a high-risk investment and you are unlikely to be protected if something goes wrong. Take 2 minutes to learn more
In the first half of March, the Bitcoin market surged into the price range of $60,000 to $75,000. Subsequently, as time progressed, the notable volatility subsided. Initially, it appeared that bullish momentum was establishing stronger support around the $65,000 level, exerting pressure on bearish positions at $75,000. However, by early April, increasing volatility favored bears, who occupied the $72,000 price level, while bulls faltered in maintaining the $65,000 level.
Consequently, they retreated to the support zone around the $60,000 price threshold. Presently, the market shows signs of rebounding from this level.
Bitcoin Market Data
- BTC/USD Price Now: $64,798
- BTC/USD Market Cap: $1.2 trillion
- BTC/USD Circulating Supply: 19.7 million
- BTC/USD Total Supply: 19.7 million
- BTC/USD CoinMarketCap Ranking: #1
Key Levels
- Resistance: $65,000, $70,000, and $75,000.
- Support: $60,000, $55,000, and $50,000.
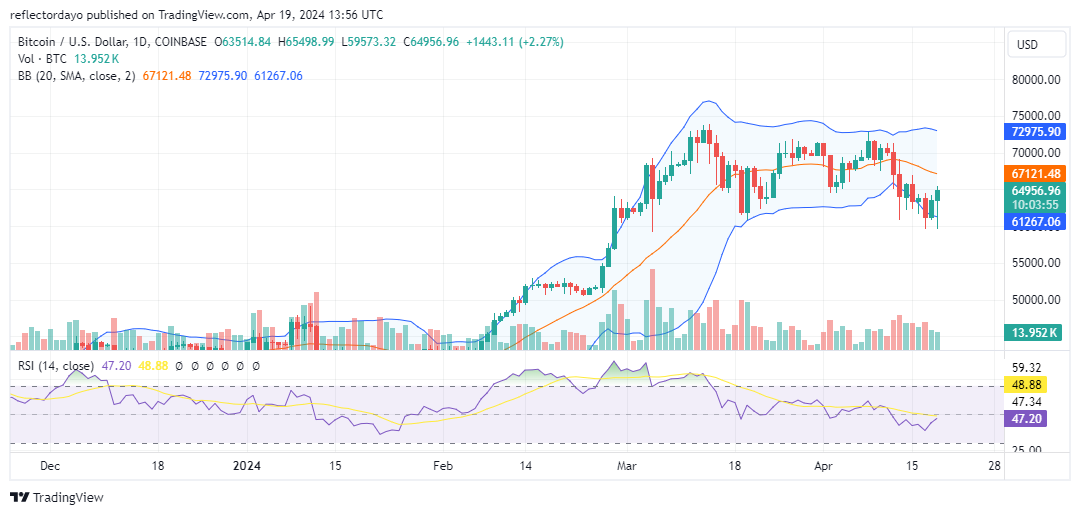
The Bitcoin Market Through the Lens of Indicators
Today’s Bitcoin market is exhibiting signs of strength, as evident from the analysis of today’s trading activities represented by the candlestick chart. While today’s trading sessions have been marked by considerable volatility, the emergence of a hammer formation suggests that bullish sentiment is gaining momentum, indicating a potential shift in market control.
Currently, bullish forces are exerting pressure on the $65,000 resistance level, despite lingering bearish sentiment at this threshold. Breaking through this resistance level is crucial for the market, as it would negate the development of a bearish trend. This is particularly significant given the bearish performance observed earlier in the week, as indicated by the Bollinger Bands beginning to trend downward. However, surpassing this threshold would effectively nullify the emergence of an impending bearish trend.
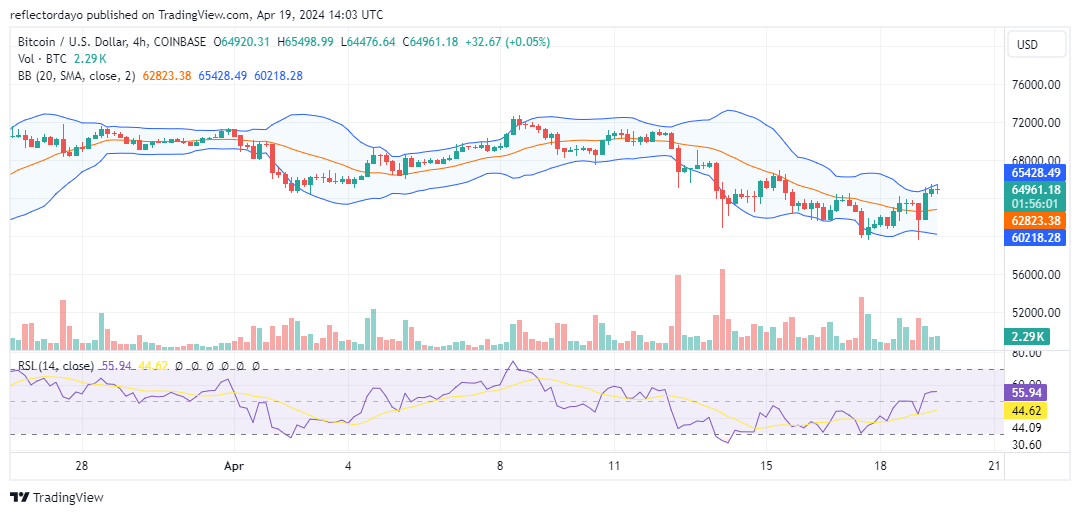
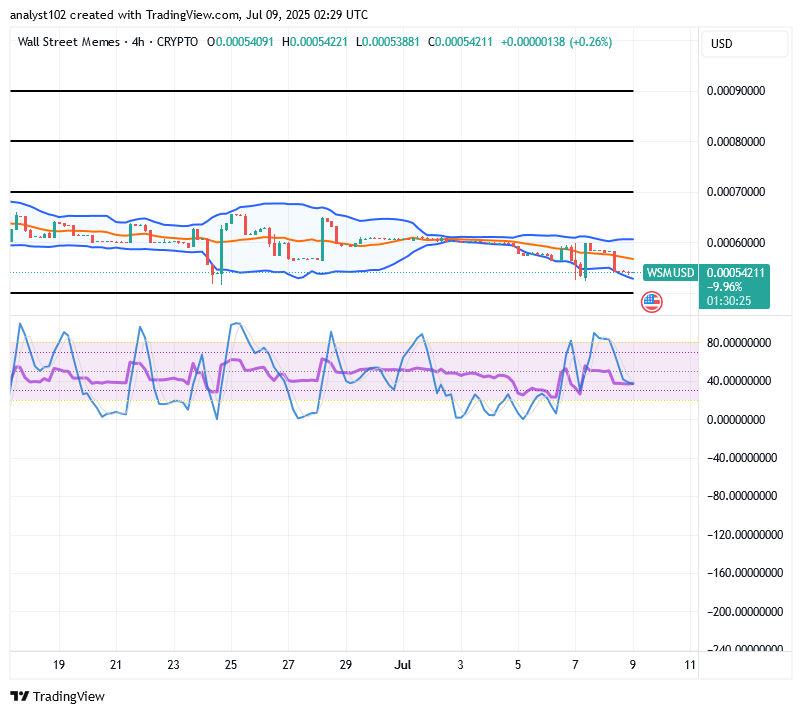
BTC/USD Price Prediction: 4-Hour Chart Analysis
The Bitcoin market has reached a stalemate as both buyers and sellers grapple for control at the $65,000 price level. Despite this crypto signal, volatility remains notably high, with the price fluctuating within close proximity to this threshold. A closer examination of the current 4-hour session reveals minimal support and resistance around the $65,000 mark, indicating a state of indecision among traders. This lack of consensus has left the market at a crossroads, with neither side able to push the price significantly below support or above resistance levels. It appears traders are awaiting a catalyst, possibly in the form of news, to prompt decisive action in the market.