Immutable X (IMX/USD) Bulls Are Becoming Stronger
Estimated Reading Time: 3 minutes
Don’t invest unless you’re prepared to lose all the money you invest. This is a high-risk investment and you are unlikely to be protected if something goes wrong. Take 2 minutes to learn more
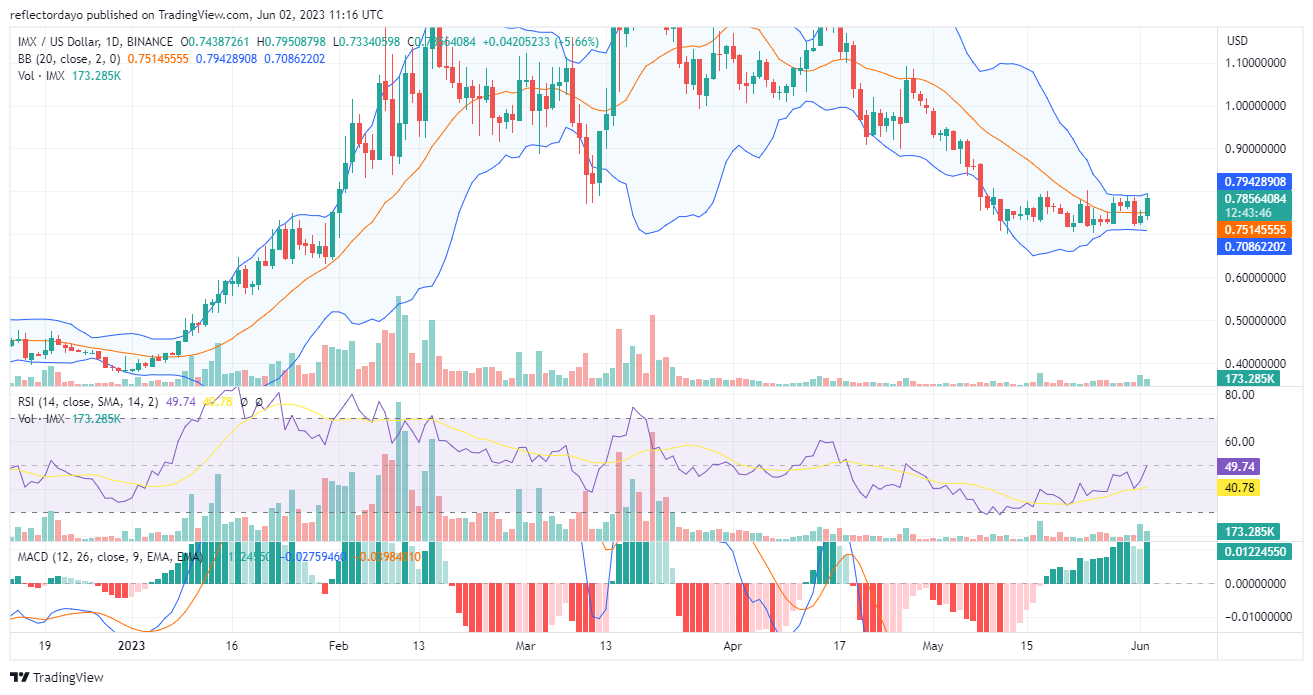
At the $0.72 price level, the IMX bulls are gaining momentum to turn the tide of the market in their favor. It all started in the previous daily session, as growing bullish sentiments around the key support level began turning the market in a bullish direction, and since then, until the moment of writing this analysis, the market has attained up to a 4.84% bullish recovery.
IMX Market Data
- IMX/USD Price Now: $0.768
- IMX/USD Market Cap: $702,049,794
- IMX/USD Circulating Supply: 914,163,546 IMX
- IMX/USD Total Supply: 2,000,000,000
- IMX/USD Coinmarketcap Ranking: #64
Key Levels
- Resistance: $0.80, $0.90, and $0.10.
- Support: $0.65, $0.60, and $0.55.
Price Prediction for Immutable X: The Indicators’ Point of View
Because the bulls have been able to sustain the bullish recovery with a steady increase in momentum since the previous daily market, a bit of an impression is now being made on the Bollinger Bands indicator. The upper band is now beginning to respond to bullish activity. In addition to that, the volume of trade indicator is beginning to reflect a bit of growing activity in the Immutable X bull market. However, between the Relative Strength Index (RSI) and the Bollinger Bands indicator, it seems like there is a bit of disagreement. In the Bollinger Bands indicator, the market is above the 20-day moving average, which should be a sign that bulls are winning. But in the Relative Strength Index, the market has just recovered to the equilibrium level. Making sense of this discrepancy, this may be the reason why the upper band of the Bollinger Band did not respond significantly to the bullish price action between yesterday and today.
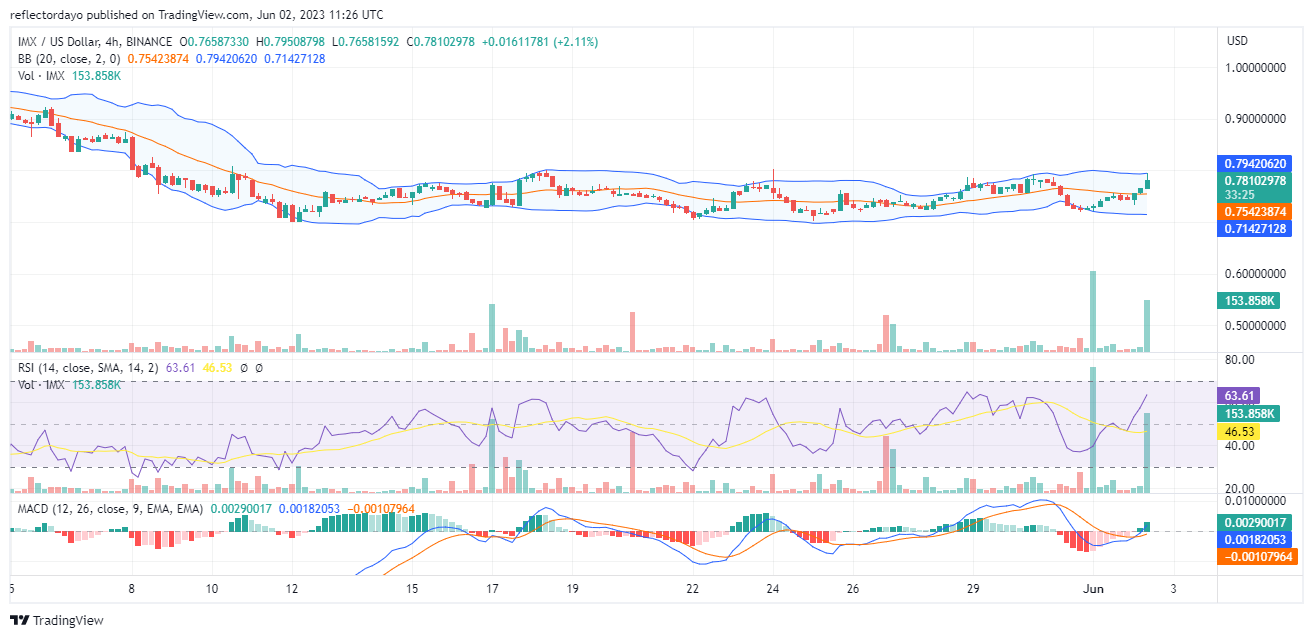
IMX/USD 4-Hour Chart Outlook:
One reason traders may want to hold off going long is that the volume of trade is falling short of what the trading chart portrays about the market. However, at some point in the market, we see a few strong, aggressive spikes in the volume of trade, which most of the time have a very small effect on the actual representation of the market for the particular 4-hour trading session. This inconsistency may be responsible for the lack of adequate response from the Bollinger Bands indicator.