Bitcoin (BTC/USD) Market Breaks Northward at $65,000 Range-Line
Estimated Reading Time: 3 minutes
Don’t invest unless you’re prepared to lose all the money you invest. This is a high-risk investment and you are unlikely to be protected if something goes wrong. Take 2 minutes to learn more
Bitcoin Price Prediction – November 10
In the recent past trading operations, the BTC/USD price traded in range-bound zones. But, the crypto-economic market currently breaks northward at the upper range line at $65,000 to now trade around $66,882 at a smaller negative percentage rate of about 1.54.
BTC/USD Market
Key Levels:
Resistance levels: $70,000, $75,000, $80,000
Support levels: $62,500, $60,000, $57,500
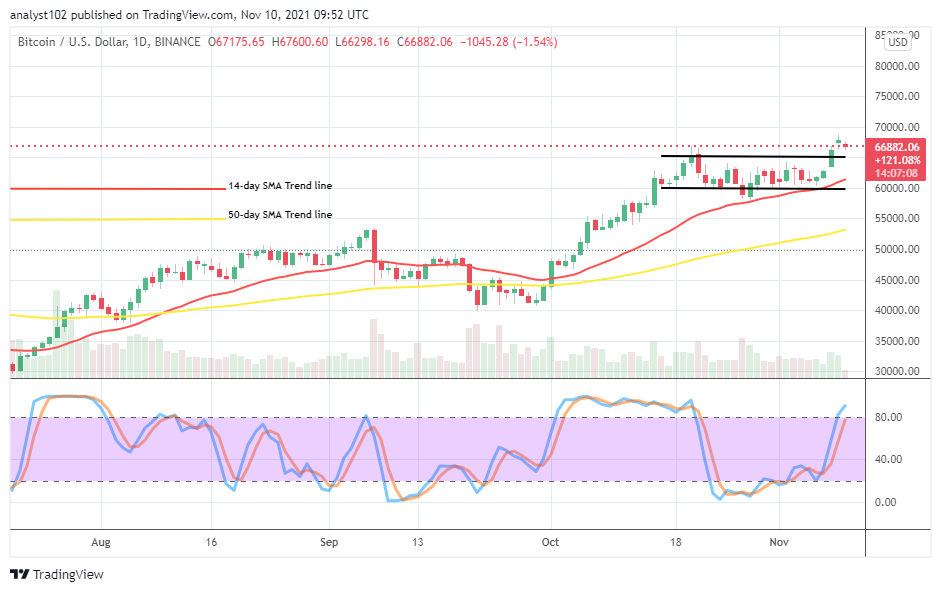
BTC/USD – Daily Chart
The BTC/USD daily chart showcases that the crypto market breaks northward at the upper range line at $65,000 to eye a high resistance level of $70,000 at a low distance trading spot. The 14-day SMA trend line has extended into the upper trading zones above the 50-day SMA trend line that positions beneath the $55,000 level. The Stochastic Oscillators are firm in making a step into the overbought region. They seem to attempt to close the lines around the range of 80. That signifies the possibility that the market may soon start to witness some resistance in its northward swings.
Can there soon be a retracement movement as the BTC/USD market breaks northward at a $65,000range line?
There can soon be a retracement movement in the BTC/USD economic price as the market breaks northward at the $65,000 range line. The presumed retracement motion may lead to bringing down the crypto’s price to re-build its support baseline around the value line mentioned or a bit lower trading spot to it afterward. Currently, long position takers need to exercise some degrees of trading cautiousness to avoid bulls running into a trap in no time.
On the downside of technical analysis, the BTC/USD market bears needed to watch out for an active resistance trading spot of a higher line before considering launching an order. Some barriers may still have to feature close beneath the resistance level of $70,000 in the subsequent sessions. A fearful breakout at that value line may push the market trading zones into resistance higher zones, for bears will have to re-find a coming-back.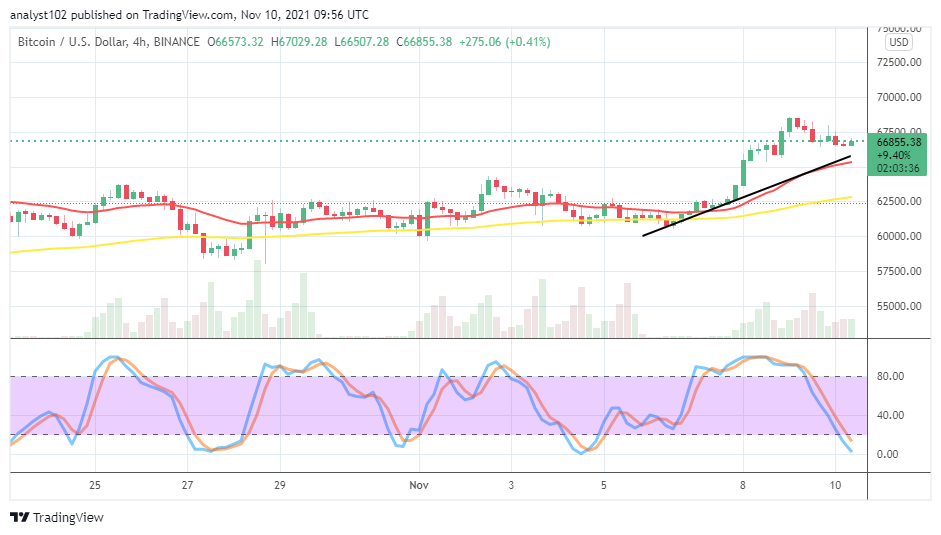
BTC/USD 4-hour Charts
The BTC/USD 4-hour chart showcases that the market breaks northward into higher trading zones above the trend lines of the SMAs. The bullish trend line and the 14-day SMA indicator draw above the 50-day SMA indicator as they all point toward the north direction. The Stochastic Oscillators have systemically dipped into the oversold region. That signifies that some degrees of downs are ongoing as they appear to be more of retracements presently.
Note: Cryptosignals.org is not a financial advisor. Do your research before investing your funds in any financial asset or presented product or event. We are not responsible for your investing results.
You can purchase crypto coins here. Buy Tokens