Quant Price Prediction: QNT/USD Can Sustain Gain Above $126 Level
Estimated Reading Time: 2 minutes
Don’t invest unless you’re prepared to lose all the money you invest. This is a high-risk investment and you are unlikely to be protected if something goes wrong. Take 2 minutes to learn more
Quant Price Prediction – April 1
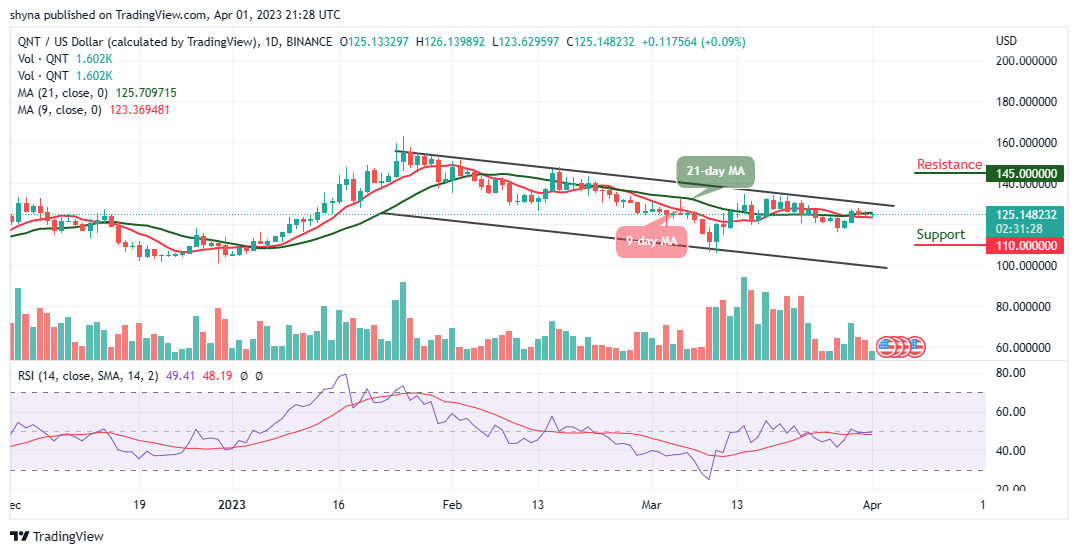
The Quant price prediction shows QNT getting ready to cross above the upper boundary of the channel after touching the $123 support.
QNT/USD Long-term Trend: Ranging (1D Chart)
Key Levels:
Resistance levels: $145, $155, $165
Support levels: $110, $100, $90
QNT/USD is ready to reclaim the $126 resistance level as the coin keeps hovering above the 9-day and 21-day moving averages. The Quant price is currently trading at $125.1 after recovering from the daily low of $123.6, meanwhile, it could probably retest this level again before heading to the upside.
Quant Price Prediction: QNT Price Will Hit Higher Levels
The Quant price will soon cross above the upper boundary of the channel, a break above this barrier will encourage more buyers to increase their entries, which could hit the resistance levels of $145, $155, and $165. On the downside, if the price breakdown and heads toward the lower boundary of the channel, the downside pressure may increase and the next support levels could be created at $110, $100, and $90 respectively. The technical indicator Relative Strength Index (14) is moving in the same direction around the 50-level, which could allow more buyers to come into the market.
QNT/USD Medium-term Trend: Ranging (4H Chart)
The Quant is hovering within the 9-day and 21-day moving averages as the coin prepares for the north. Meanwhile, any bullish movement above the upper boundary of the channel will encourage the buyers to extend the rally toward the resistance level of $135 and above.
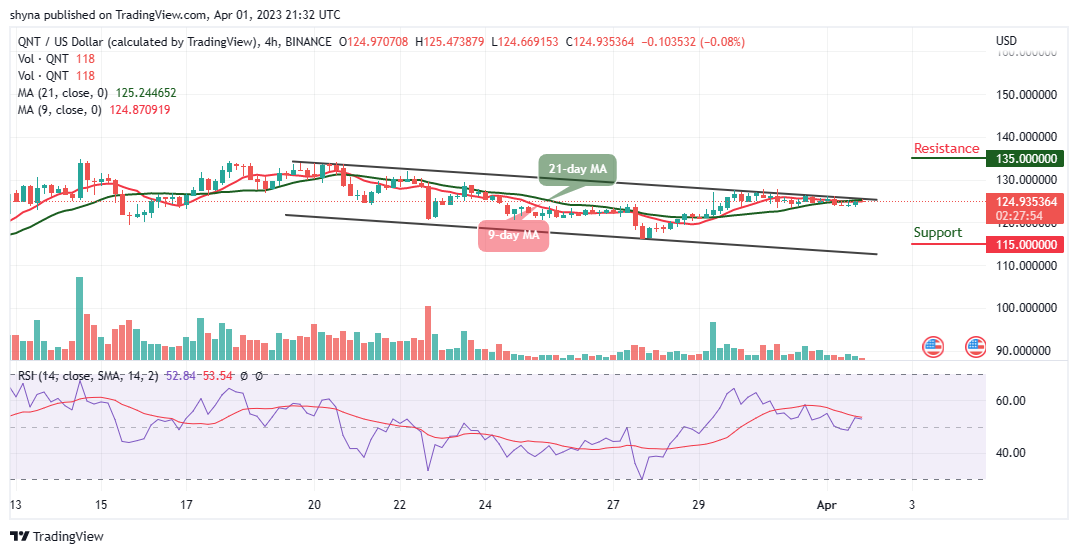
However, should the coin slides and face the lower boundary of the channel, it could hit the support level of $115 and below. Meanwhile, there is a possibility that the Quant will begin the upward movement if the technical indicator Relative Strength Index (14) remains above the 60-level.
Place winning Quant trades with us. Get QNT here