Lucky Block Price Prediction: LBLOCK/USD Gets Ready for $0.000100 Resistance
Estimated Reading Time: 3 minutes
Don’t invest unless you’re prepared to lose all the money you invest. This is a high-risk investment and you are unlikely to be protected if something goes wrong. Take 2 minutes to learn more
Lucky Block Price Prediction – August 10
The Lucky Block price prediction shows that LBLOCK will cross above the upper boundary of the channel to spike higher.
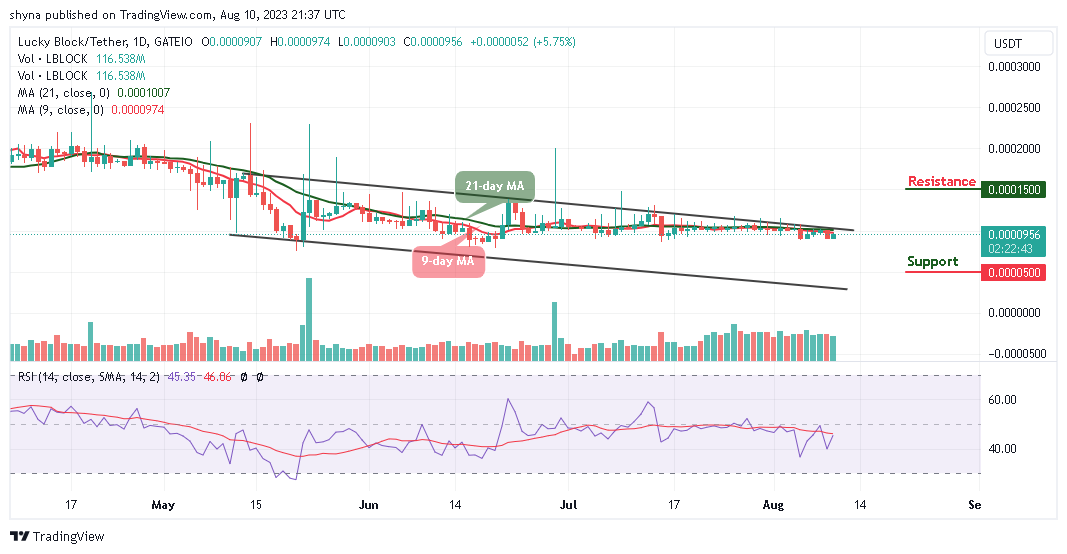
LBLOCK/USD Long-term Trend: Ranging (1D Chart)
Key Levels:
Resistance levels: $0.000150, $0.000160, $0.000170
Support levels: $0.000050, $0.000040, $0.000030
LBLOCK/USD is likely to cross above the 9-day and 21-day moving averages as the current movement keeps suggesting a bullish movement by moving in the next positive direction. However, buyers are expected to invest more as a bullish movement will resume in the market soon.
Lucky Block Price Prediction: LBLOCK/USD Will Head to the Upside
The Lucky Block price will begin to experience an increasing volume as the market moves to cross above the 9-day and 21-day moving averages. Therefore, should the coin delay its bullish movement, the bears could step into the market but new buyers are expected to come into the market. Meanwhile, if the selling resumes back, it could bring the coin to the support levels of $0.000050, $0.000040, and $0.000030.
On the same note, the Lucky Block price can spike above the upper boundary of the channel, if the technical indicator Relative Strength Index (14) crosses above the 50-level. Nevertheless, the potential resistance levels could be located at $0.000270, $0.000290, and $0.000310 will come to play if the bulls increase the pressure.
LBLOCK/USD Medium-term Trend: Ranging (4H Chart)
The Lucky Block price is hovering above the 9-day and 21-day moving averages; the Lucky Block is following a bullish movement. However, if the price continues to break toward the upper boundary of the channel, the market could touch the resistance level at $0.000110 and above.
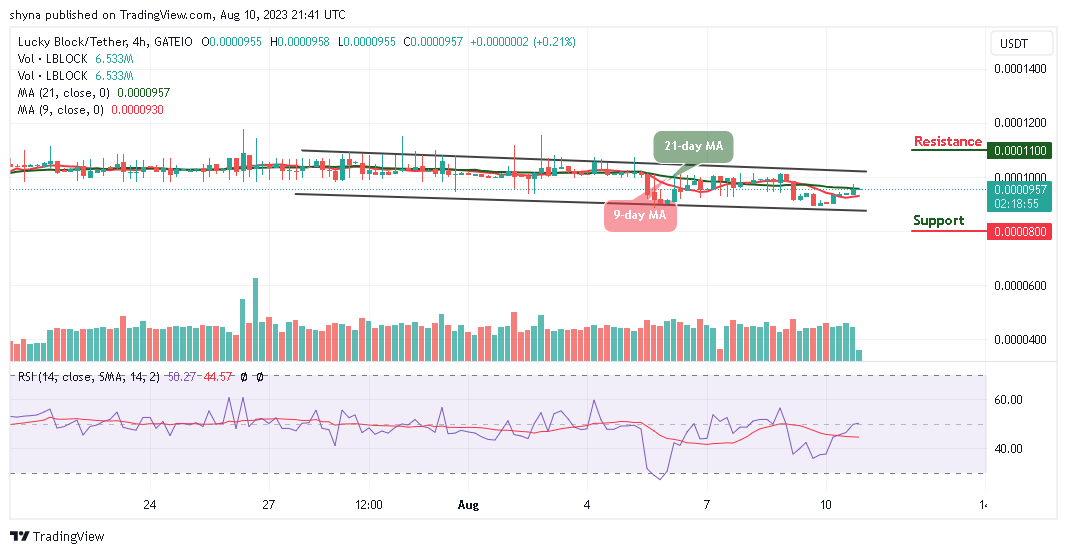
In other words, the Lucky Block price could retreat and crosses below the lower boundary of the channel to hit the support at $0.000080 and below so that more buyers can come into the market. However, the technical indicator Relative Strength Index (14) is moving in the same direction around the 50-level, suggesting sideways movement.
You can purchase Lucky Block here. Buy LBLOCK