Solana (SOL) Price Prediction: SOL/USDT Still Facing Challenge
Estimated Reading Time: 3 minutes
Don’t invest unless you’re prepared to lose all the money you invest. This is a high-risk investment and you are unlikely to be protected if something goes wrong. Take 2 minutes to learn more

Solana Price Prediction: May 2, 2025
The Solana market has not been able to successfully breach the resistance at $160.00. As a result, previous attempts to reach this price level have failed. Nevertheless, the market is now progressing toward that same price point, which remains a significant resistance level.
SOL/USDT Long-Term Trend: Bullish (Daily Chart)
Key Price Levels:
Resistance: $150.00, $160.00, $170.00
Support: $140.00, $130.00, $120.00
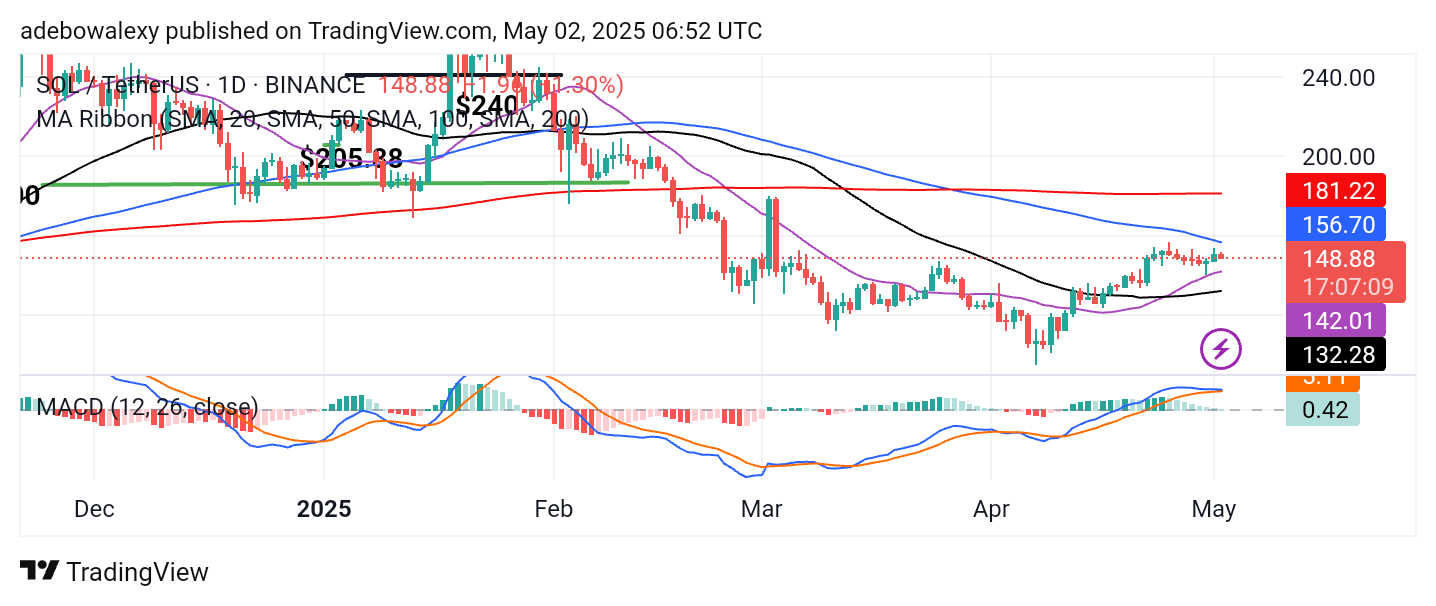
The ongoing session holds some important technical levels. However, the corresponding price candle is red, which indicates short-term selling pressure. As a result, price action remains below the 100-day Moving Average (MA) line. Additionally, the Moving Average Convergence Divergence (MACD) lines are positioned above the equilibrium level. However, due to the erratic movement of price action on the daily chart lately, the MACD lines appear to be moving sideways.
Solana (SOL) Price Prediction: SOL/USDT Moves Slowly Toward the $155.00 Mark
The Solana market has been facing strong bearish sentiment. Previously, the market experienced a phase of continuous but moderate downward retracements. However, price action managed to rebound from the support level around the 50-day MA line. As a result, although the ongoing session is bearish, the price remains afloat above the 20- and 50-day MA lines.
The MACD lines also stay above the equilibrium level, while its histogram bars are pale green. This indicates a reduced bullish momentum. The sideways orientation of the MACD lines aligns with the muted appearance of the histogram bars. Despite the short-term weakness, the overall trend still leans bullish, suggesting that the market may continue to move higher.
Solana Price Prediction: SOL/USDT Market Maintains a Fair Stand Despite Minimal Retracement
On the 4-hour chart, Solana price action maintains an elevated position above most of the MA lines. The most recent price candle is red and appears more prominent than the previous ones, indicating growing bearish pressure. However, the candle still stands just above the 20-day MA line.
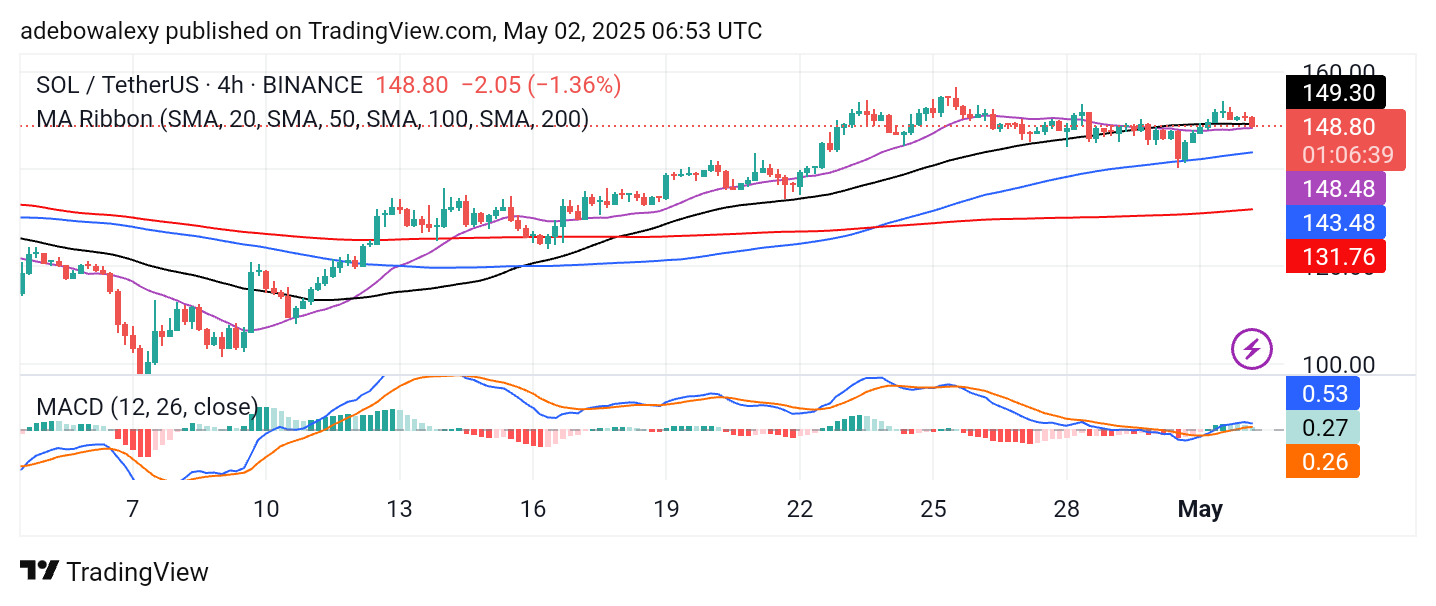
At this point, the MACD lines are hovering just above the equilibrium level, showing signs that bearish momentum may be increasing. The MACD histogram bars are pale red, which suggests weakening upside strength. Technically, this implies that bullish forces are being challenged. Nevertheless, the broader trend remains intact. Therefore, traders may still aim for the $160.00 price level with cautious optimism.

