Uniswap (UNI) Price Prediction: UNI/USDT Respects the $6.00 Ceiling
Estimated Reading Time: 2 minutes
Don’t invest unless you’re prepared to lose all the money you invest. This is a high-risk investment and you are unlikely to be protected if something goes wrong. Take 2 minutes to learn more

Uniswap Price Prediction: May 1, 2025
The Uniswap market has remained below the $6.00 price level for some time. There are indications that suggest price action may not be ready to breach this apparent resistance anytime soon.
UNI/USDT Long-Term Trend: Bullish (Daily Chart)
Key Price Levels:
Resistance: $6.00, $6.50, $7.00
Support: $5.50, $5.00, $4.50
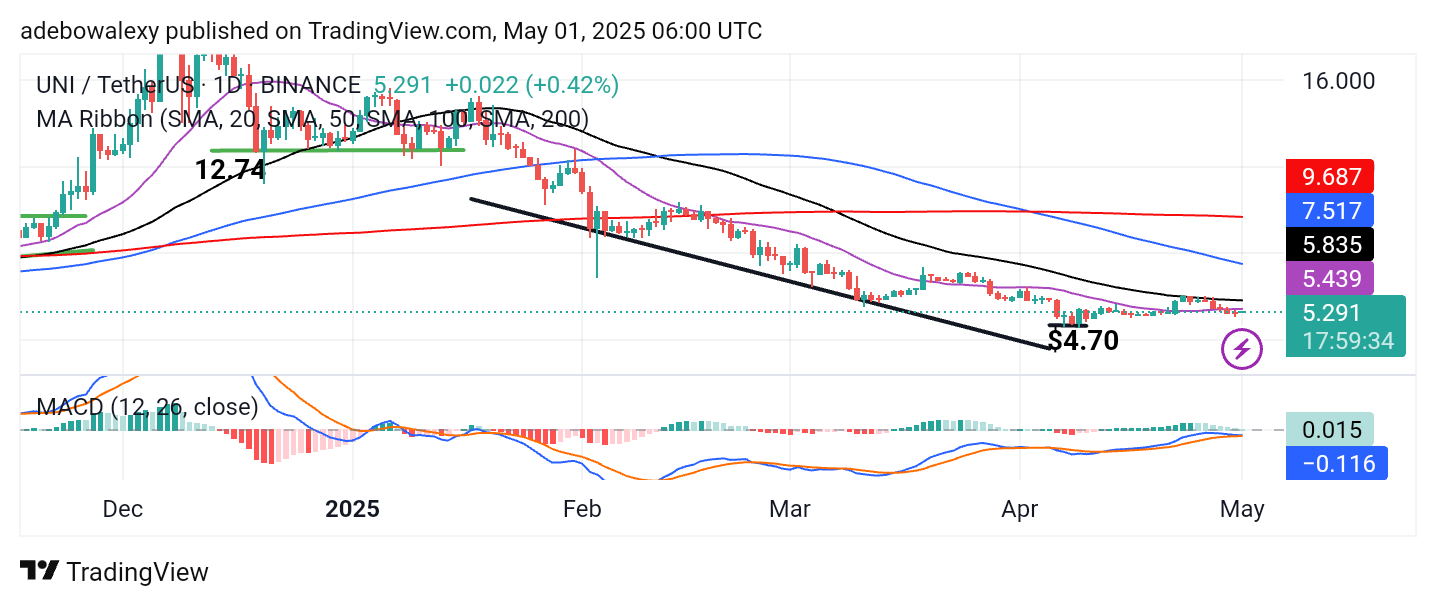
The Uniswap daily chart has shown price action in the green, albeit with minimal gains. As a result, the most recent price candle appears flat but green. Additionally, this candle remains positioned below all the Moving Average (MA) lines. Furthermore, the Moving Average Convergence Divergence (MACD) lines appear to have previously converged, though a clear crossover has not yet materialized.
Uniswap (UNI) Price Prediction: UNI/USDT Lacks the Push to Proceed Higher
Recently, Uniswap’s price action has gradually slipped below all the MA lines. The latest price candle is green but heavily compressed, indicating strong indecision and tug-of-war between buyers and sellers.
The prior convergence of the MACD lines suggested bearish momentum, but the absence of a confirmed bearish crossover now implies that bullish forces are still present and countering the downward pressure.
Uniswap Price Prediction: UNI/USDT Market Stays Under Tremendous Downward Pressure
On the 4-hour chart, it’s evident that downward forces continue to dominate, effectively resisting any significant upward movement. For the past two sessions, the price candles have been green but have shown only minimal progress. These candles also remain below all the MA lines.
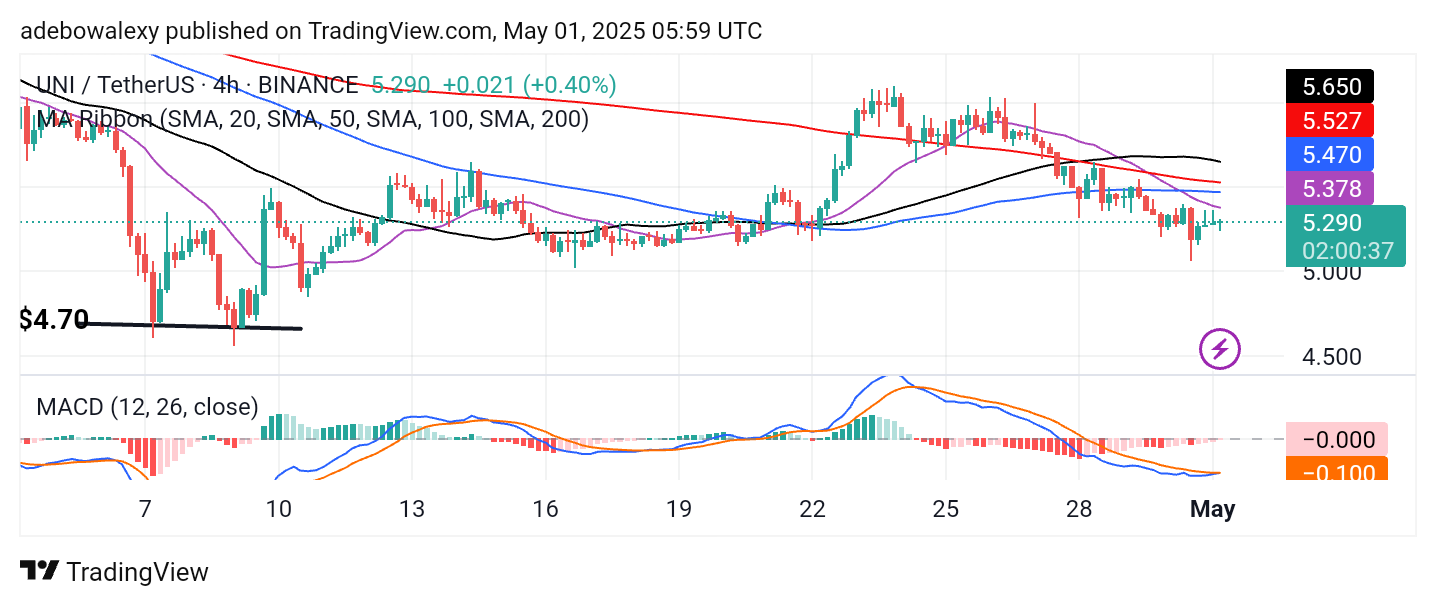
That said, the MACD lines are converging below the equilibrium level, possibly preparing for a bullish crossover. Moreover, the diminishing size of the MACD histogram bars suggests that bearish momentum may be weakening in the short term. Despite this, traders are advised to remain cautious and focus on nearby targets around the $6.00 level.